
FIGURE 1.
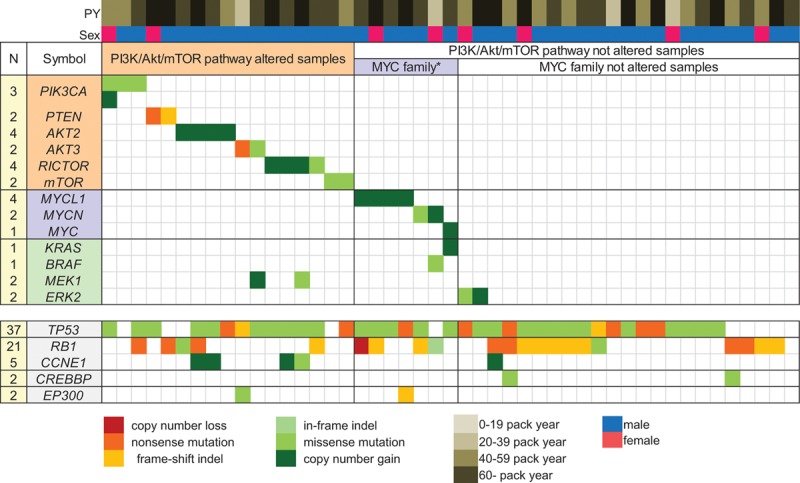
An overview of the key driver mutations and major associated clinical features of 47 SCLC samples. The number of events per gene is noted on the left. The genes are displayed as rows, and the samples are displayed as columns, with major associated clinical features.
PY, pack years; MYC family*, MYC family altered samples.