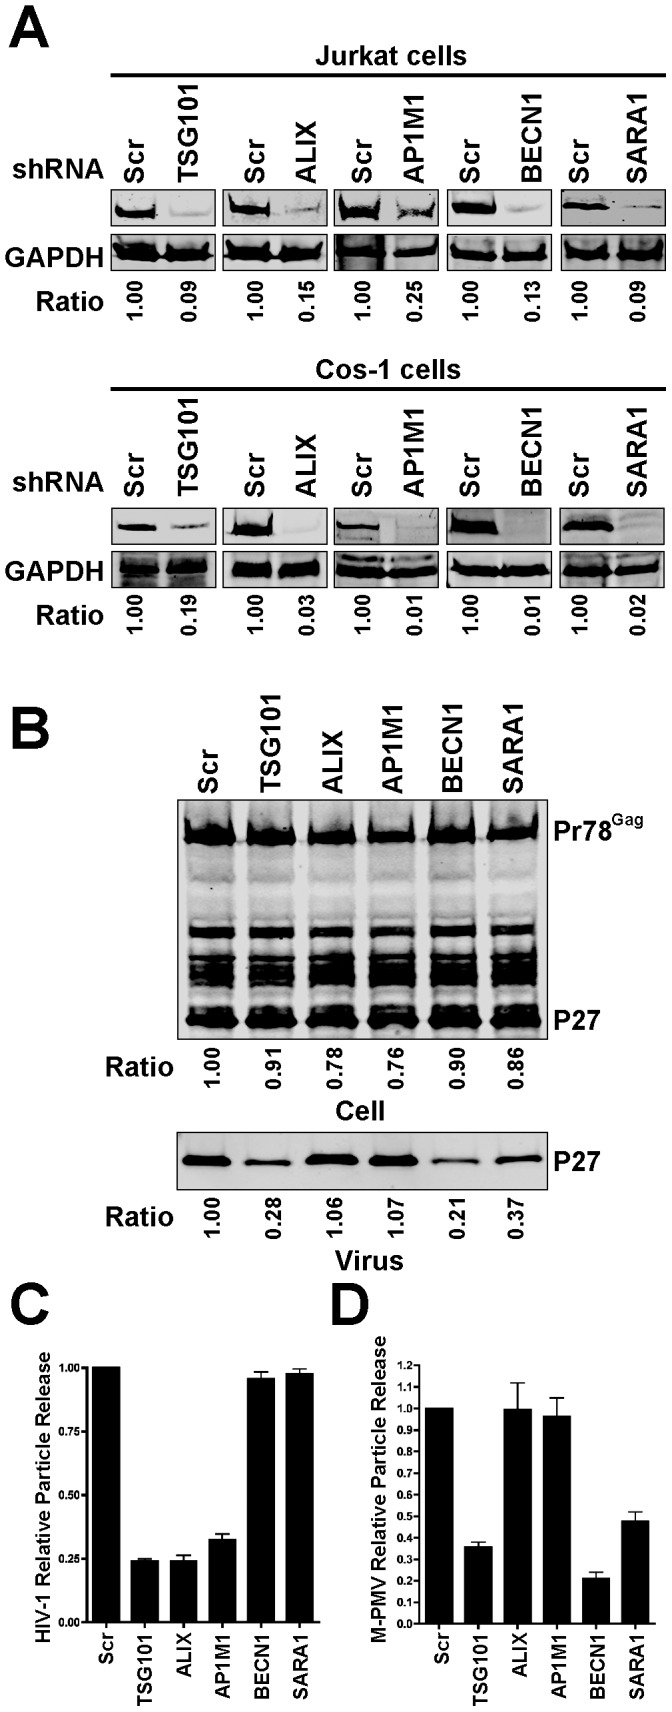
Figure 6. Effect of silencing of TSG101, ALIX1, AP1M1, BECN1 and SARA1 on HIV-1 and M-PMV particle output.

(A) Quantitative western blots showing knockdown efficiency of the individual genes in Jurkat cells and Cos-1 cells. Jurkat cells and Cos-1 cells stably expressing control shRNA or specific shRNAs against individual genes were generated, and the cellular levels of the individual proteins examined by immunoblotting. The ratio of the individual protein levels as quantified on the LiCor Odyssey compared to control cell is shown below each blot. (B) The effect of depleting the individual genes on M-PMV particle output. Cos-1 cells stably expressing control shRNA or the indicated shRNAs were transfected with pSARMX M-PMV proviral vector. At 48 hours after transfection, the virions in the supernatant and cell lysates were harvested and subjected to immunoblotting with p27 antibody. The ratio of supernatant p27 and the ratio of the total amount of cellular p27 and Pr78Gag as quantified on the LiCor Odyssey compared to control cells are shown below each blot. (C) The effect of depleting the individual genes on HIV-1 particle release in Jurkat cells. Control shRNA or specific shRNA expressing Jurkat cells were infected with vesicular stomatitis virus G glycoprotein (VSV-G)-pseudotyped HIV-NL4-3 virus (at 1 TCID50) overnight at 37°C, washed and then seeded in 12-well plates. HIV-1 particle release was assessed using a p24 antigen ELISA 2 days post-infection. Results were expressed as percentage Gag release (supernatant p24/(supernatant + cellular p55/p24)) normalized to control shRNA-expressing cells. Error bars indicate the standard deviation of three independent experiments. (D) Quantitative analysis of the effect of depleting the individual genes on M-PMV particle release. M-PMV particle release in the control shRNA or specific shRNA expressing Cos-1 cells was assessed by immunoblotting with p27 antibody. The supernatant p27 and cellular p27 and Pr78Gag were quantified on the LiCor Odyssey. Results were expressed as percentage Gag release (supernatant p27/(supernatant + cellular Pr78Gag/p27)) normalized to control shRNA-expressing cells. Error bars indicate the standard deviation of three independent experiments.
