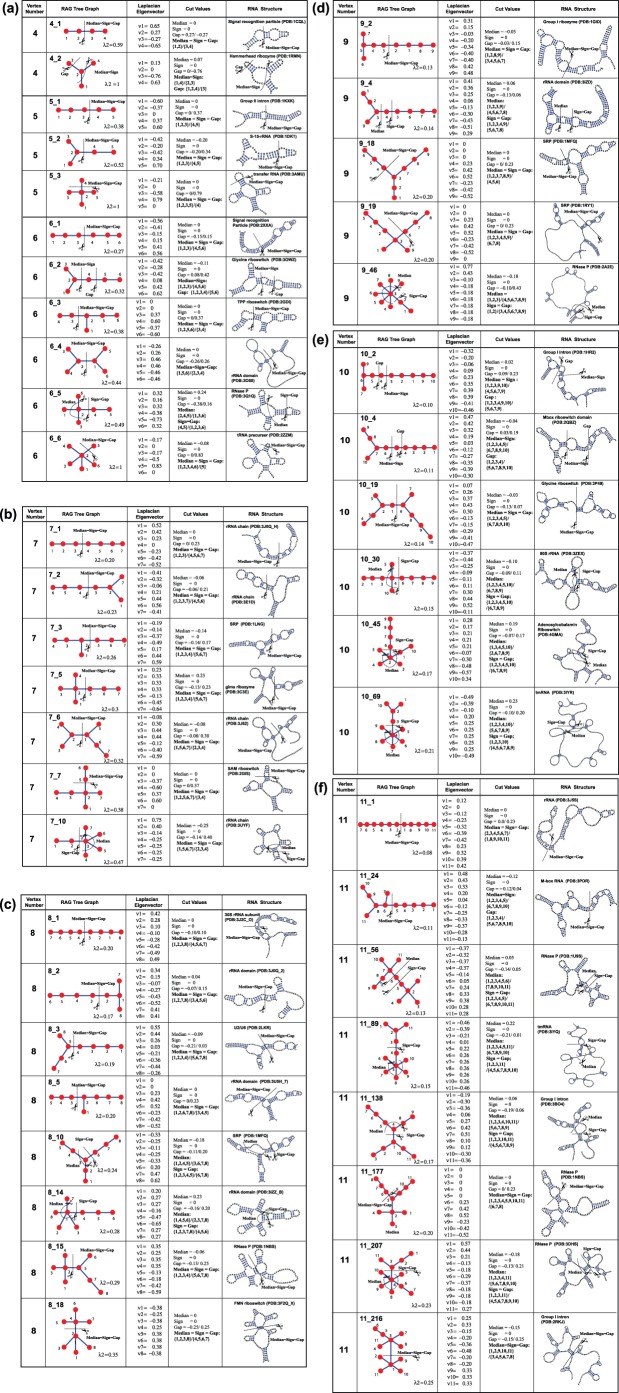
Figure 2. Graph partitioning results for RNAs corresponding to RAG tree graphs with vertex number (a) V = 4, 5, or 6, (b) V = 7, (c) V = 8, (d) V = 9, (e) V = 10, and (f) V = 11.
RAG tree graph, Laplacian eigenvector, cut values/results of median/sign/gap partitions, and corresponding RNA secondary structures are shown.

