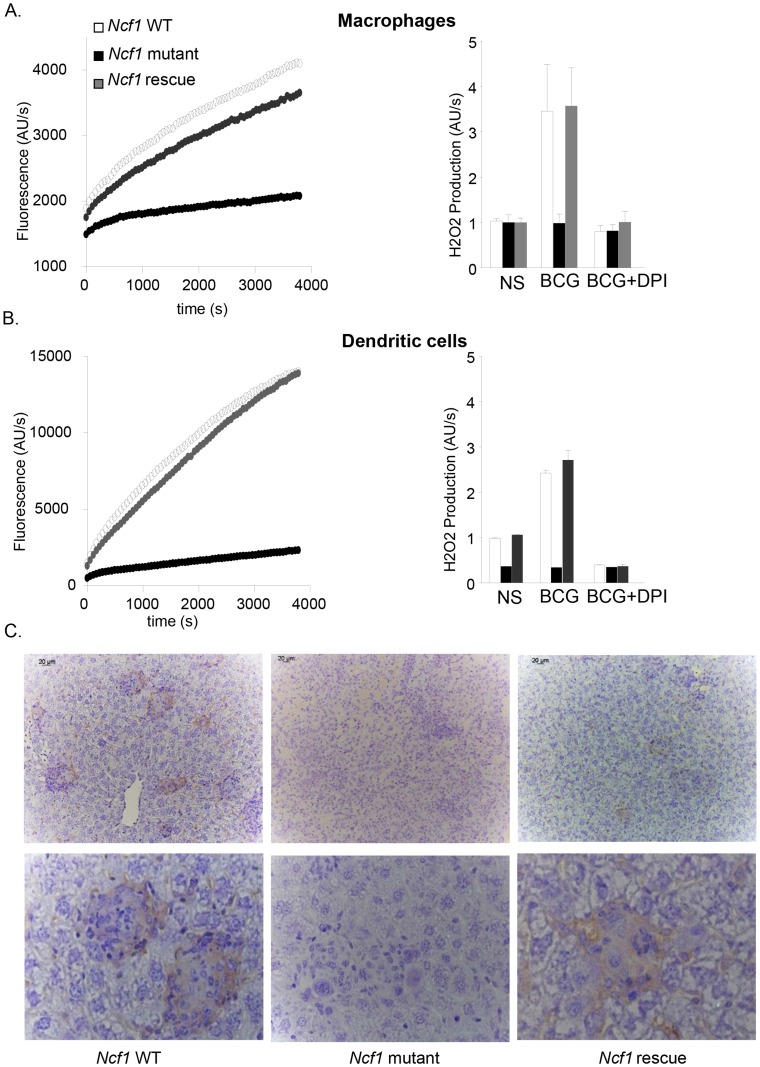
Figure 6. ROS generation in response to BCG in vitro and in vivo.
(A) Bone marrow-derived macrophages and (B) dendritic cells were obtained from wild-type, Ncf1 mutant and Ncf1 rescue mice. H2O2 release was measured by Amplex red. Left panels: Cells were stimulated with BCG. Representative kinetic graphs of ROS production as measured by fluorescence emission. Right panels: Cells were exposed to PBS (NS) or BCG; where indicated, the inhibitor DPI was added. Histograms representing ROS production of three independent experiments performed in duplicate (mean ± SEM). (C) Representative images of immunohistochemistry for 8-hydroxy-2′-deoxyguanosine (8-OHdG) in liver sections from wild-type, Ncf1 mutant and rescue mice obtained 4 weeks post infection. Magnifications were ×200 (upper panel C) and ×1000 (lower panel).

