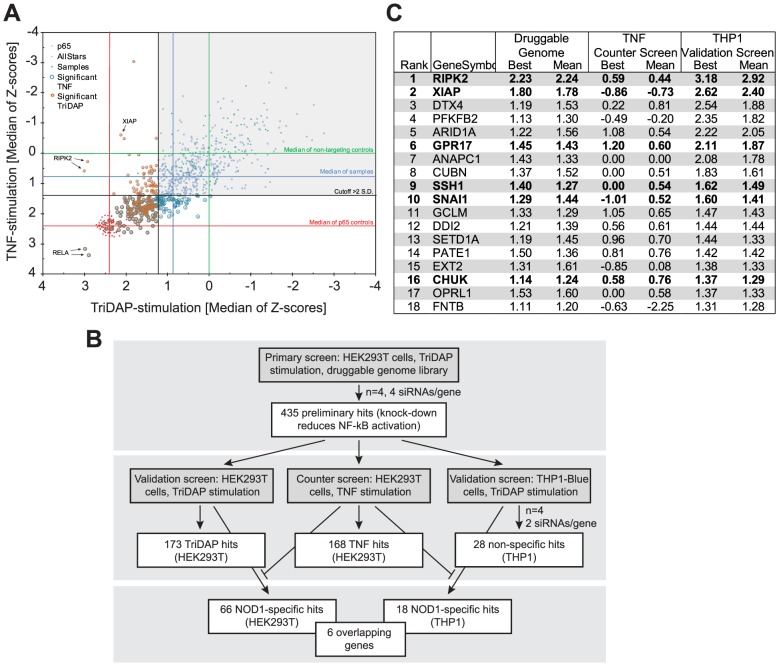
Figure 1. HTS siRNA-screening identifies SSH1 as novel component of the NOD1-pathway.
(A) Combined Z-scores of the primary-hits in the counter screen with TriDAP (NOD1,ordinate) and TNF (abscissa) activation. (B) Flow-chart representing the screening procedure. Number of hits (genes) of each step is indicated. (C) Final hitlist ranked according to the THP1 results (best). Candidates validated in all steps and not affecting TNF signaling are shown in bold. Z-score were normalized to control siRNAs set to 0. (see also Figures S1, S2 and Table S1).

