
Figure 1. Genotyping and phenotyping of global Nav1.7 knockout animals.
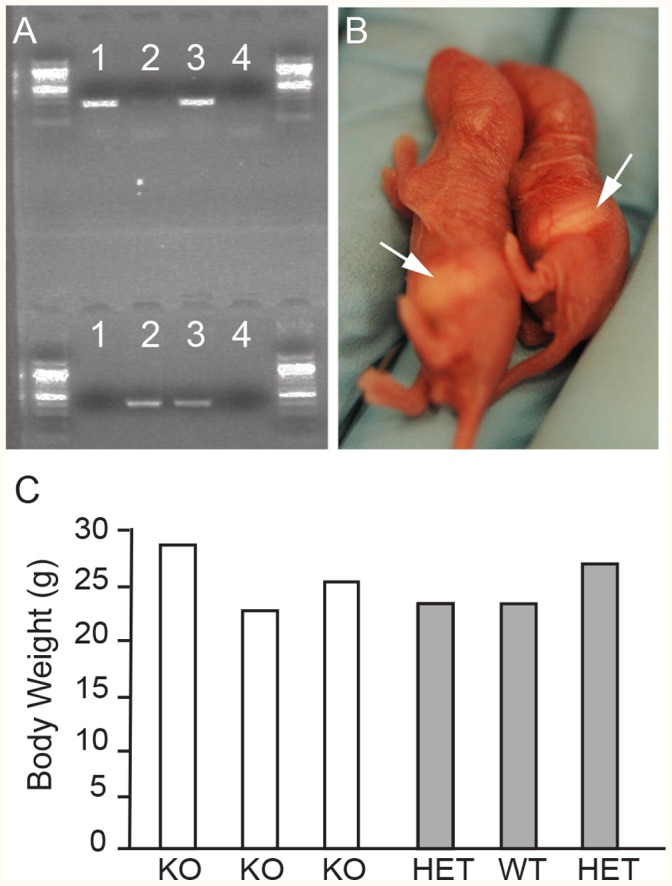
A. Example of endogenous (top - 267 bp) and targeted (bottom - 389 bp) PCR products obtained from DNA isolated from Nav1.7 WT (lane 1), KO (lane 2) and HET (lane 3) animals, while the last lane serves as a negative control (no DNA). All PCRs were run using a 1 kb PLUS DNA ladder. B. Photos of postnatal day 2 littermates showing their capability in feeding naturally by the presence of milk spots in control (see arrow left) and KO (see arrow right) and slight size difference in young animals. C. Body weight (grams) comparison between six female littermates at nine weeks of age that represented all three genotype classes illustrating the absence of size difference in adult animals.