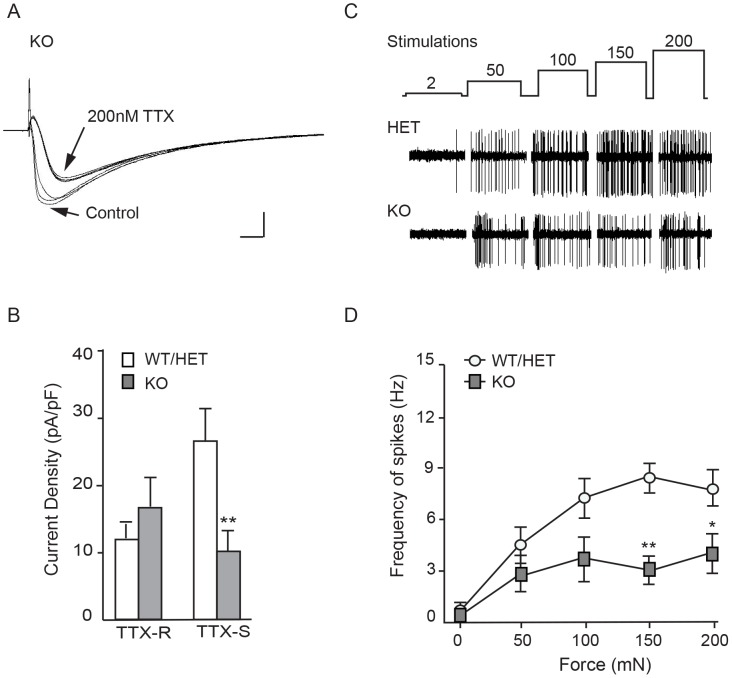
Figure 6. TTX-sensitive currents and mechanically-evoked spiking of C-fibers are reduced in KO mice.
A. Representative current traces showing the effect of 200 nM TTX on a KO DRG neuron. Overlaid sweeps show the time course of selective TTX blockade of fast-inactivating currents. Sweeps shown are the three before and the three after TTX addition (inter-sweep interval 10 s). Scale bars, 200 pA and 2 ms. B. Average current densities from acutely dissociated Nav1.7 KO and age-matched WT adult DRG neurons. TTX-S currents: 10.1±3.06 pA/pF, n = 12 neurons from 2 KO animals; and WT/HET, 27.2±4.53 pA/pF, n = 16 neurons from 4 control animals (2 WT and 2 HET) (p = 0.0074, unpaired t-test, mean ± S.E.M.). TTX-R currents: 16.9±4.44 pA/pF from KO, 11.9±3.26 from WT/HET (p = 0.3638, unpaired t-test, mean ± S.E.M.). Cell capacitance averaged 50.2 pF ±5.7 pF from WT/HET and 65.4 pF ±8.6 pF from KO (p = 0.069, unpaired t-test, mean ± S.E.M.). C. Representative mechanically-evoked action potentials in saphenous nerve. Upper trace shows the stimulation protocol (mN); middle and lower traces show representative action potentials from a single C-fiber from a Nav1.7 HET and a Nav1.7 KO preparation respectively. D. Frequency of mechanically-evoked action potentials from C fibers was significantly reduced in Nav1.7 KO mice (filled squares, n = 9 fibers) at forces ≥150 mN when compared to those recorded in C fibers from Nav1.7 control animals (open circles, n = 13 fibers) (150 mN: 8.71±0.86 Hz in control; 3.20±0.76 Hz in KO (mean ± S.E.M., two way ANOVA; p<0.01); 200 mN: 8.1±1.11 in control, 4.14±1.14 Hz in KO (mean ± S.E.M., two way ANOVA, p<0.05)).

