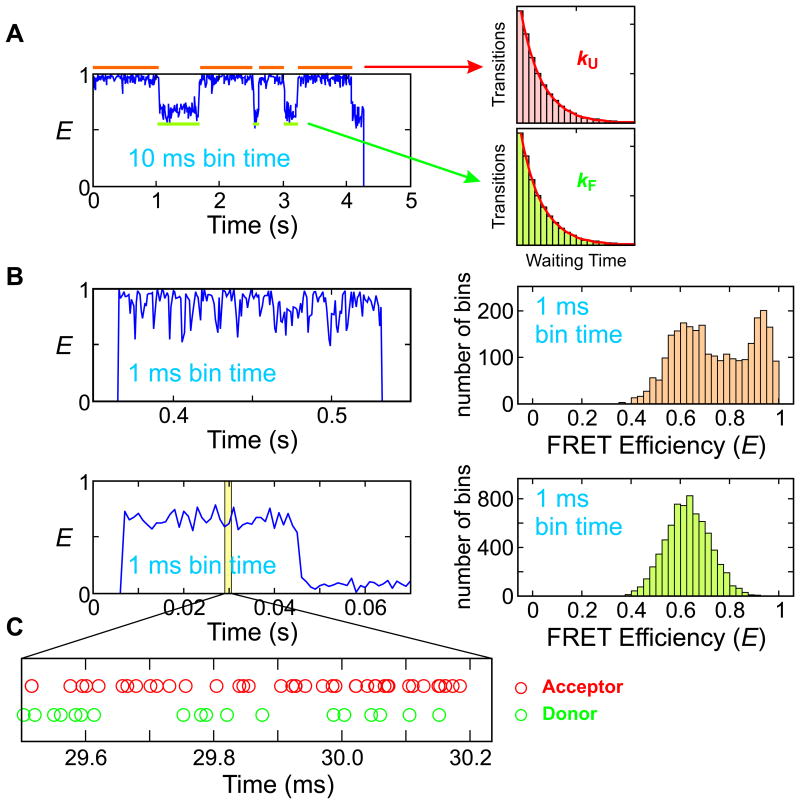
Figure 1.
Kinetic measurement in single-molecule spectroscopy. (A) Slow two-state transitions. Two states with high (folded) and low (unfolded) FRET efficiencies are clearly seen in the FRET efficiency trajectory (left). Folding and unfolding rate coefficients can be obtained from the decay of the waiting time distributions (right). (B) When the timescale of the kinetics is similar to or faster than the bin time, the waiting time distribution cannot be constructed because states are not distinguishable. The FRET efficiency trajectories (left) and histograms (right) were obtained from two-state proteins α3D (top) and the WW domain (bottom) near the mid-point of guanidine hydrochloride (GdmCl) denaturation. (C) A photon trajectory from the WW domain can be used to determine the waiting times in the folded and unfolded states deduced from the color patterns, but a rigorous statistical analysis (maximum likelihood method) is required to obtain accurate model parameters. Data and figures from Refs. 27,35,36.

