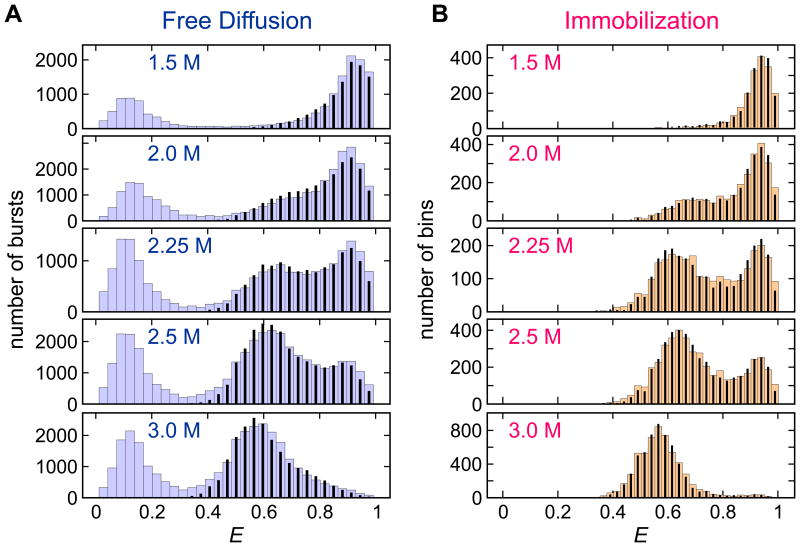
Figure 2.
Experimental (wide bars) and recolored (narrow bars) FRET efficiency histograms of Alexa 488/Alexa 594-labeled α3D in the free diffusion experiment (A) and immobilization experiment (B) at various GdmCl concentrations. In the free diffusion experiment, histograms were constructed from bins (2 ms bin time) containing more than 30 photons. Histograms for the immobilization experiment (1 ms bin time) were constructed from the trajectories with the mean photon count rate > 15 ms-1. In the free diffusion data, the peak at E ∼ 0.1 corresponds to the molecules missing an acceptor or with an inactive acceptor. Such molecules were filtered out in the immobilization data. For the recolored histograms, the photons in the trajectories were recolored using the two-state model parameters obtained by maximizing the likelihood function in Eq. (1). Figures from Ref. 27.

