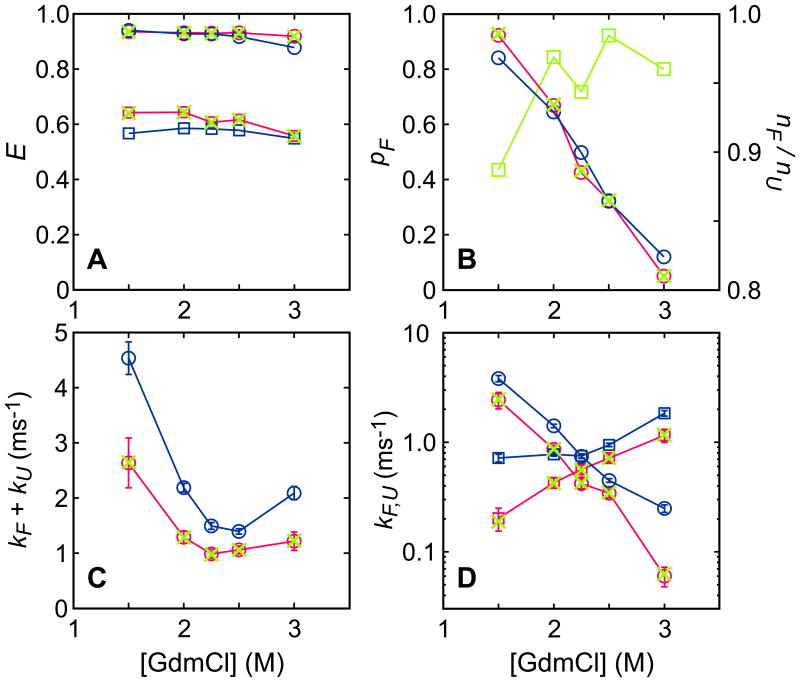
Figure 3.
Parameters obtained by maximizing the likelihood function with FRET efficiencies, Eq. (1), for free diffusion (blue) and immobilization (red) experiments and the likelihood function with count rates, Eq. (4), for the immobilization experiment (green crosses). (A) FRET efficiencies of folded and unfolded states. (B) Fraction of folded molecules pF (circle). Green squares show the ratio of the photon count rate in the folded state to that in the unfolded state nF/nU. (C) Relaxation rates kF + kU. (D) Individual folding (kF, circle) and unfolding (kU, square) rate coefficients. Figures from Ref. 27.

