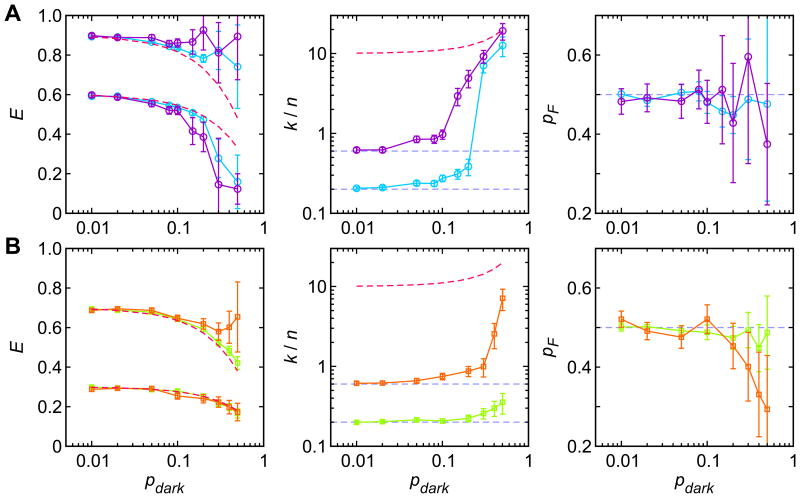
Figure 8.
The effect of the dark state population (pdark) on the two-state maximum likelihood parameters. 5 sets of 100 30 ms-long photon trajectories with a photon count rate n = 50 ms-1 were simulated using 4 model parameter sets. (A) EF = 0.9, EU = 0.6, k/n = 0.2 (light blue circle) and EF = 0.9, EU = 0.6, k/n = 0.6 (purple circle). (B) EF = 0.7, EU = 0.3, k/n = 0.2 (light green square) and EF = 0.7, EU = 0.3, k/n = 0.6 (orange square). pF = 0.5, kb = 500 ms-1, and kd = kb(1- pb)/pb. Horizontal dashed lines indicate these model parameters. The red dashed curves in the left panels guide the effective FRET efficiencies in the fast blinking limit EFpb + EDpd and EUpb + EDpd. The red dashed curve in the middle panels guides the relaxation rate between the bright and dark states (kb + kd). The errors are the average standard deviations obtained from the curvature of the likelihood function at the maximum.

