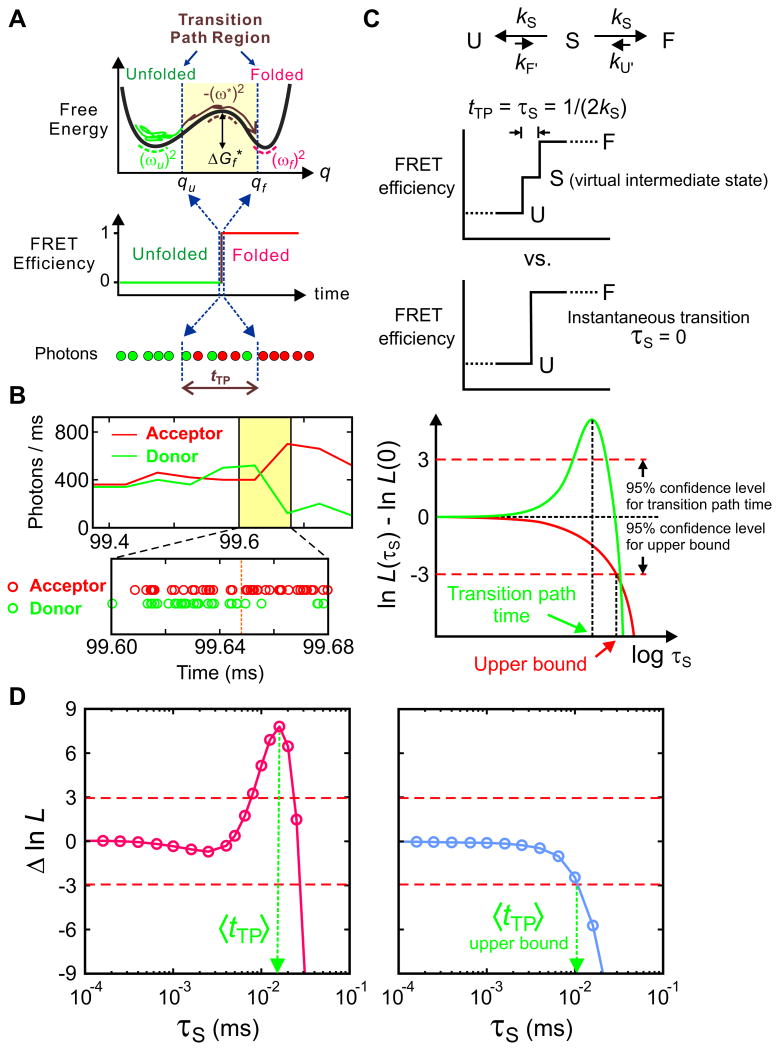
Figure 9.
(A) Schematics of a folding transition path for a two-state protein in a one-dimensional free energy profile as a function of a reaction coordinate (q). In the folding reaction, a protein spends most of the time in the unfolded well exploring the unfolded conformations to cross the free energy barrier to the folded state. The transition path is one that leaves the unfolded well, crosses qu on the reaction coordinate, and reaches qf on the other side of the barrier without re-crossing qu (brown trajectory). The transition path corresponds to the ‘jump’ in the FRET efficiency trajectory. (B) Representative binned fluorescence trajectory and photon trajectory of the WW domain. (C) Maximum likelihood method to determine the average transition-path times. The average transition path time, tTP, is equal to the lifetime of a virtual intermediate state S [τS = (2kS)−1] in the three-state model describing the transition path from the unfolded (U) to the folded (F) states. The plot of the difference of the log-likelihood, Δln L = ln L(τS) − ln L(0), compares the two models: three-state model with a finite transition path time and a two-state model with an instantaneous transition. The horizontal dashed line at Δln L = +3 represents the 95% confidence limit for the significance of the peak for the measurement of the transition path time and the intersection of the likelihood function with the horizontal dashed line at Δln L = −3 yields the 95% confidence limit for the upper bound of the transition path time. (D) The transition path time of the WW domain is 16 μs at 10 cP (50% glycerol, 3 M GdmCl), which is extrapolated to ∼ 2 μs at aqueous viscosity and the upper bound of the transition path time of protein G B1 domain is 10 μs (4 M urea). Data and figures from Ref. 36 and 57.

