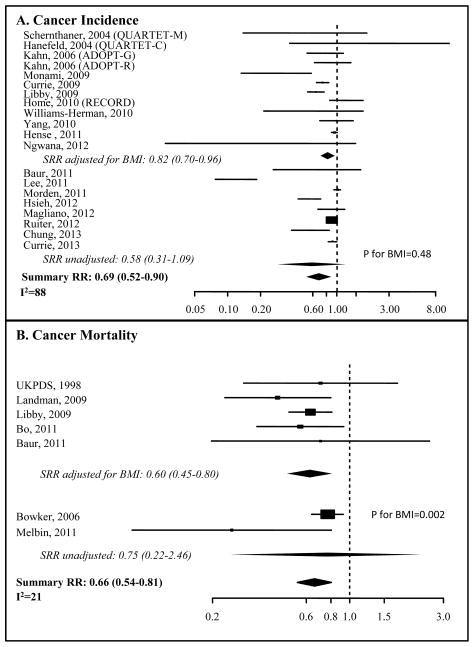
Figure 2. Forest Plot of the association between metformin and cancer incidence or cancer mortality.
Forest plots of risk estimates from observational studies and randomized controlled trials of metformin use and cancer incidence (A) or cancer mortality (B). Black boxes indicate hazard ratios (HRs), and horizontal lines represent 95% confidence intervals (CIs). Black diamonds represent the summary relative risk estimates. The vertical dotted line represents a risk estimate of 1.00.

