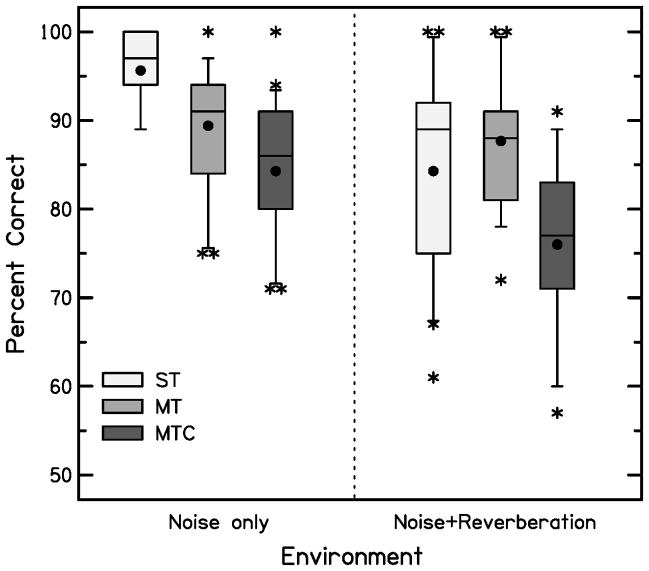
Figure 3.
Percent-correct scores for the three talker conditions (single-talker [ST]; multiple talkers [MT], multiple talkers with comments [MTC]) in the noise-only (left) and noise-plus-reverberation (right) environments. Boxes represent the interquartile range and whiskers represent the 5th and 95th percentiles. For each box, the mid-line represents the median and the filled circle represents the mean score. Asterisks represent values that fell outside the 5th or 95th percentiles.

