
Fig. 5. NACK is required for Notch-mediated transformation and tumorigenesis.
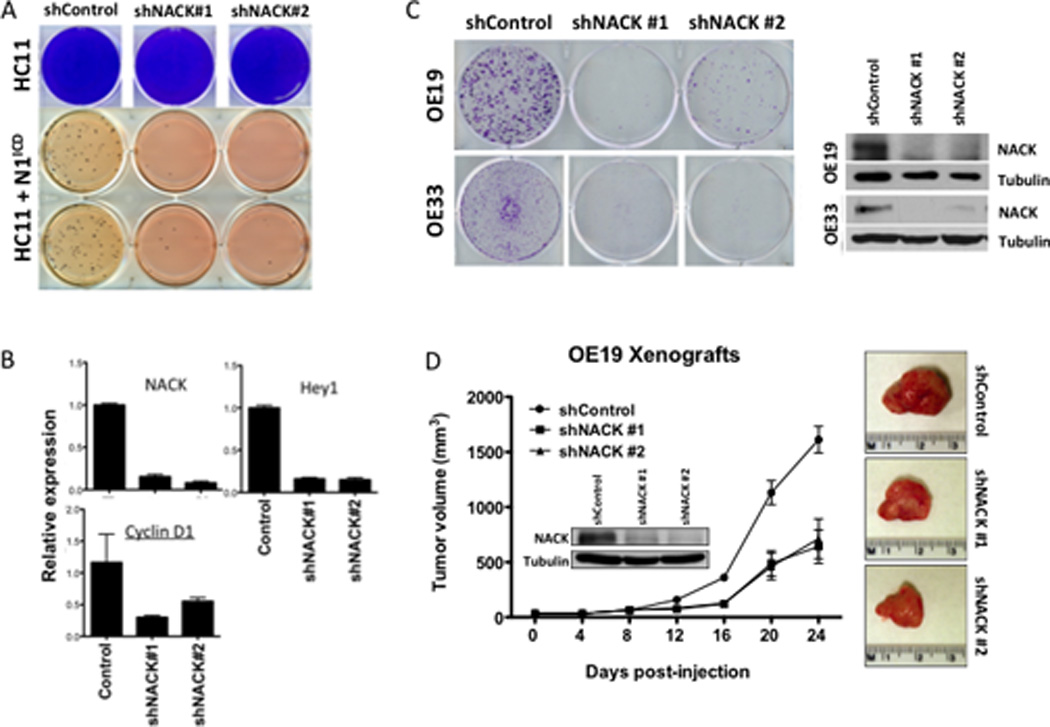
A. Upper panel, colony growth of HC11 cells infected with shRNA against NACK. Lower panel, growth of HC11 cells infected with N1ICD and shRNA against NACK in soft agar. B. Expression of NACK, Hey1, and Cyclin D1 in HC11 cells infected with shRNA against NACK. Bars represent mean (SEM) of fold-change relative to control shRNA. C. Colony formation in OE19 and OE33 cells infected with shRNA against NACK. NACK knockdown was verified by western blot. D. Xenograft formation from OE19 cells infected with shRNA against NACK. Tumor volume was measured weekly and error bars indicate SEM. n=8 per group. At 24 d post-injection, tumors were harvested and representative images are shown from each group.