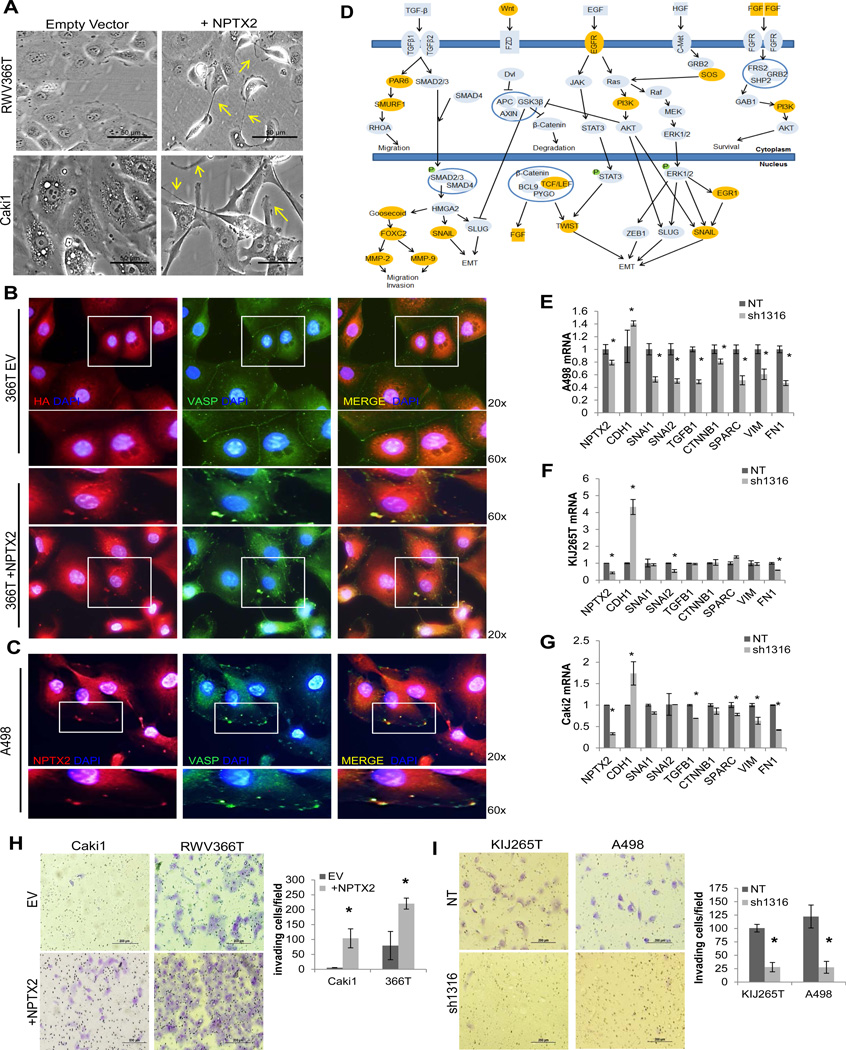
Figure 2. NPTX2 modulates actin cytoskeletal remodeling and promotes invasion.
(A) Phase-contrast microscopy of empty vector vs. NPTX2 transfected (+NPTX2) RWV366T and Caki1 cells, taken at 20x magnification. Arrows are used to highlight select membranous protrusions. IF of (B) empty vector vs. NPTX2 (HA tagged) transfected (+NPTX2) RWV366T cells and (C) A498 cells stained for NPTX2 (left panel) and VASP (center panel). Images are merged in the right panel. 60x magnification of regions highlighted in 20x images are shown. (D) Pathway signature of EMT/cell migration in high-NPTX2 expressing tumors identified using Ingenuity Software analysis. Genes highlighted in orange are significantly upregulated in high-NPTX2 expressing tumors (P<0.05). QPCR for EMT-associated genes in NT vs. sh1316 NPTX2 knockdown (E) A498, (F) KIJ265T, and (G) Caki2 cells. Invasion assay of (H) empty vector vs. NPTX2 over-expressing Caki1 and RWV366T cells and (I) KIJ265T and A498 NT vs. sh1316 NPTX2 knockdown cells. Experiments were performed in triplicate, and representative images are displayed. Results are quantitated as invading cells per visual field.

