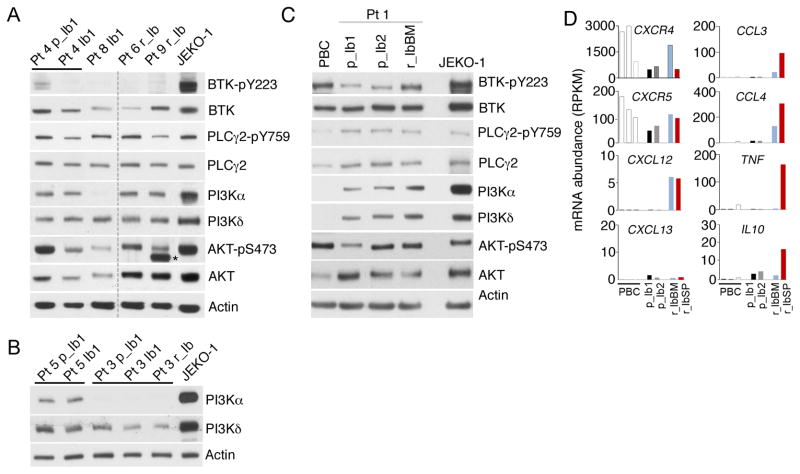
Figure 3. Concurrent inactivation of BTKWT and AKT by ibrutnib in responding patients and AKT activation independent of BTKWT inactivation in ibrutinib resistant patients.
A, B, immunoblotting of indicated proteins in MCL cells isolated from responding Pt 4 before (Pt 4 p_Ib1) and on 21 day of ibrutinib treatment (Pt 4_Ib1), Pt 8 on 21 day of ibrutinib treatment (Pt 8 Ib_1), primary resistant Pt 6 and Pt 9 on 21 day of ibrutinib treatment, Pt 5 and Pt 3 before ibrutinib treatment (Pt 5 p_Ib1, Pt 3 p_Ib1), on day 21 (Pt 5 Ib1, Pt 3 Ib1) of ibrutinib treatment and at relapse (Pt 3 r_Ib) after 3 months of ibrutinib response (See Supplementary Table S5 for details). N.S. denotes a non-specific signal. C, immunoblotting of MCL cells from serial lymph node biopsies of Pt 1 before ibrutinib treatment (p_Ib1, p_Ib2) and from the bone marrow at relapse from ibrutinib (r_IbBM). CD19+ B cells isolated from peripheral blood of healthy donors (PBCs) and JEKO-1 cells were used as controls. D, WTS analysis of mRNA abundance (RPKM) of indicated genes serial biopsies of Pt 1 and PBCs, as shown in Figure 1.

