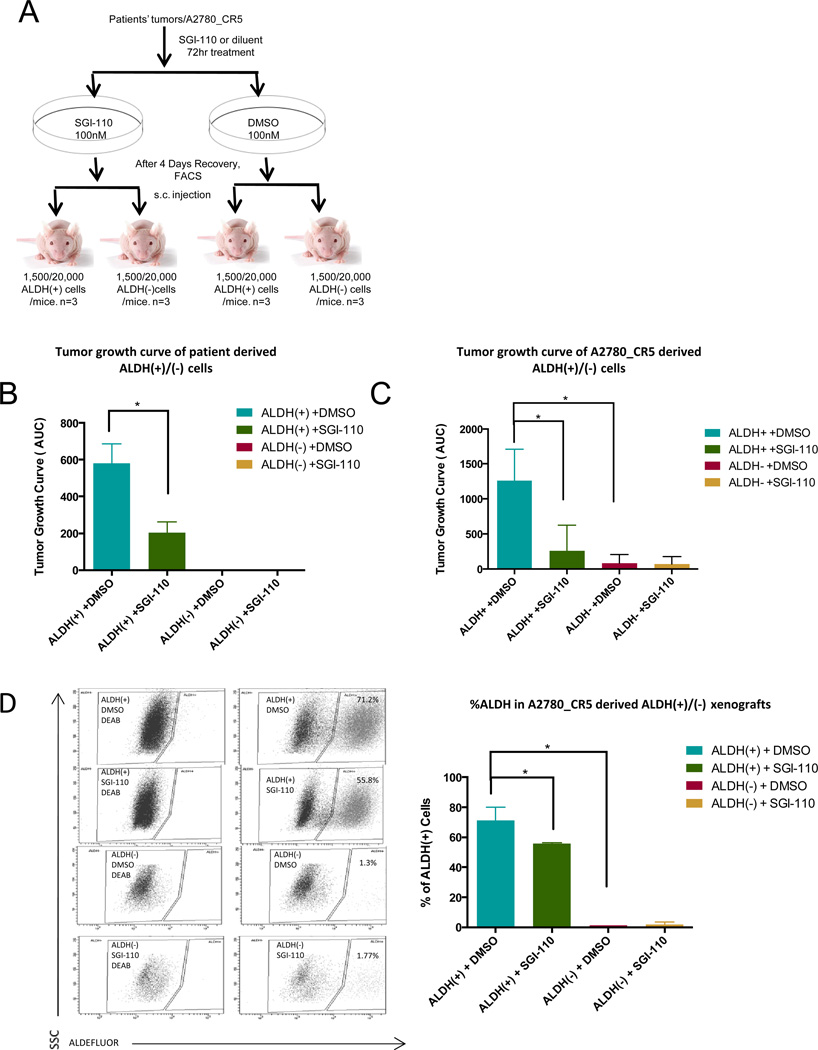
Figure 3. SGI-110 decreases tumorigenesis by targeting ALDH(+) cells.
(A) Schematic diagram of the approach used to study in vivo tumorigenesis of low dose SGI-110 untreated and treated ALDH(+)/(−) cells. (B) Primary xenograft tumor growth curve of 1,500 patient-derived ALDH(+) or ALDH(−) cells pretreated with SGI-110 (100nM) for 72h or DMSO in mice (n=3 for each group) during 8 weeks. Average of area under the curve (AUC) was calculated and shown in the histogram. ALDH(+)/(−) cells isolated from three high grade serous human tumors (1,500 cells per mouse). (C) Xenograft tumor growth curve of 20,000 A2780_CR5-derived ALDH(+) or ALDH(−) cells pretreated with SGI-110 (100nM) for 72h or DMSO in mice in 7 weeks (n=3 for each group). AUC was calculated and shown in the histogram. (D) Average number of ALDH(+) population present in untreated or SGI-110 (100nM) pre-treated A2780_CR5-derived ALDH(+) or ALDH(−) xenograft tumors. Mean values ± SD of three independent experiments (*: P<0.05, **: P<0.01, ***: P<0.001).

