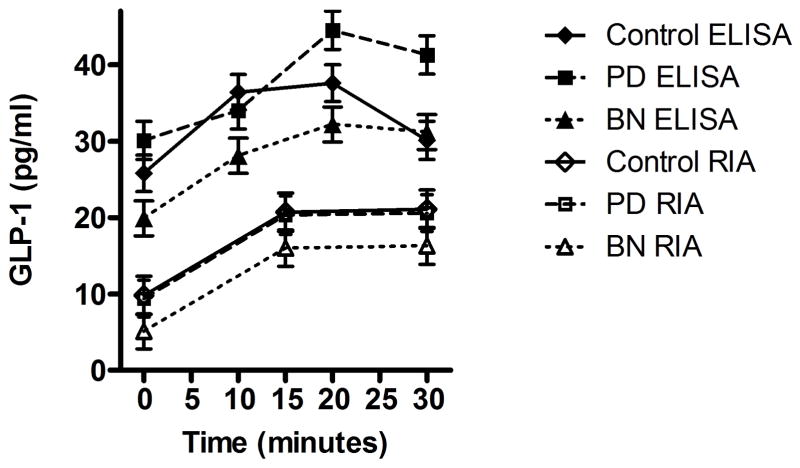
Figure 1. GLP-1 Concentrations over Time across Groups by Assay Method.
Plasma levels of GLP-1 in women with bulimia nervosa (BN), purging disorder (PD), and healthy control subjects (Control) in response to a test meal. Baseline pre-prandial measurement is designated as 0 on the x-axis. Values obtained via ELISA represented by filled markers and values obtained via RIA are represented by open markers. Plasma concentrations of GLP-1 pre- and post-prandially are lower in women with BN as compared to Controls (p<0.05) and PD participants (p<0.001). GLP-1, glucagon-like peptide 1. RIA: n = 12 BN, n = 8 PD, n = 8 Controls; ELISA: n = 7 BN, n = 6 PD, n =6 Controls.

