
Figure 3.
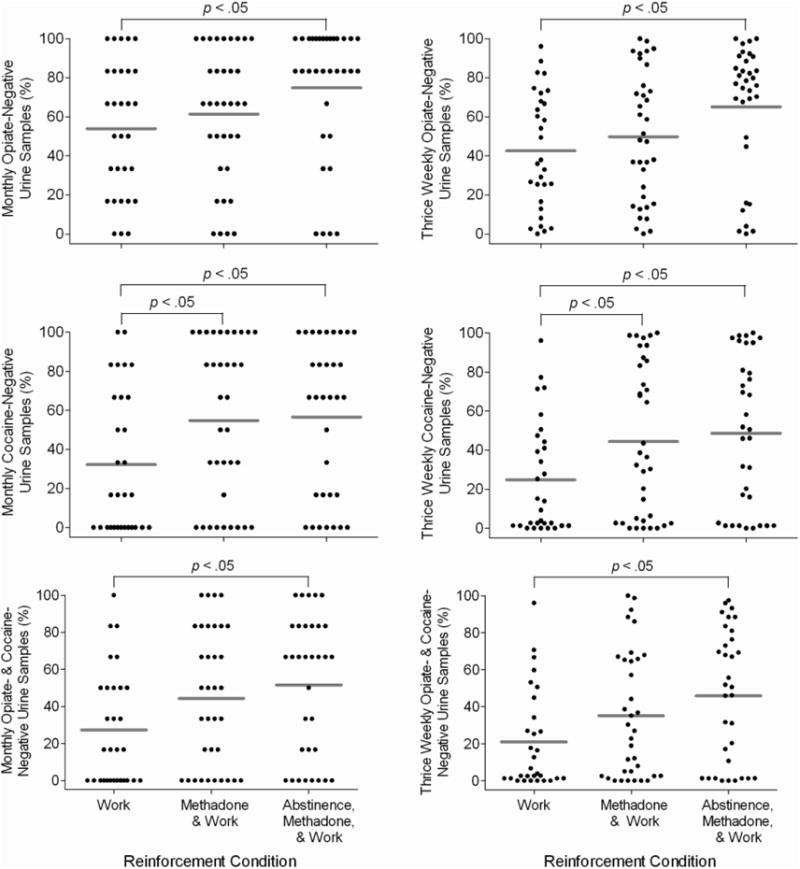
The percentage of urine samples negative for opiates (top graphs), cocaine (middle graphs), and both opiates and cocaine (bottom graphs) during the monthly (left panel) and thrice-weekly (right panel) assessments. The data points represent individual participants and the horizontal lines indicate condition means. The study was conducted in Baltimore, MD from December 2008 to December 2012.