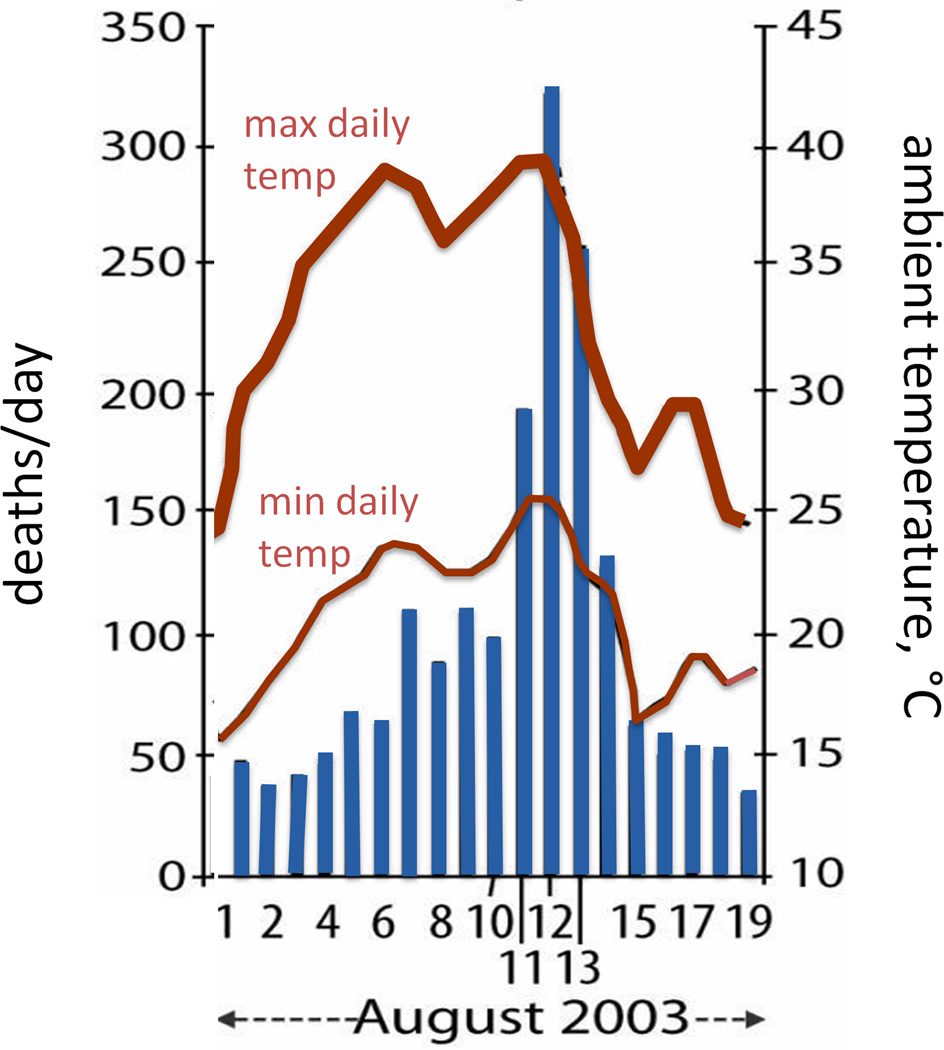
Figure 1.
Daily deaths (left axis) and minimum and maximum air temperatures (right axis) during the 2003 French heat wave. The abnormally hot daily temperatures in early August 2003 were followed by a consequent dramatic increase in daily mortality, mostly among the elderly. Redrawn from Dousset et al. International Journal of Climatology 2011, 31:313–323; Royal Meteorological Society (14).

