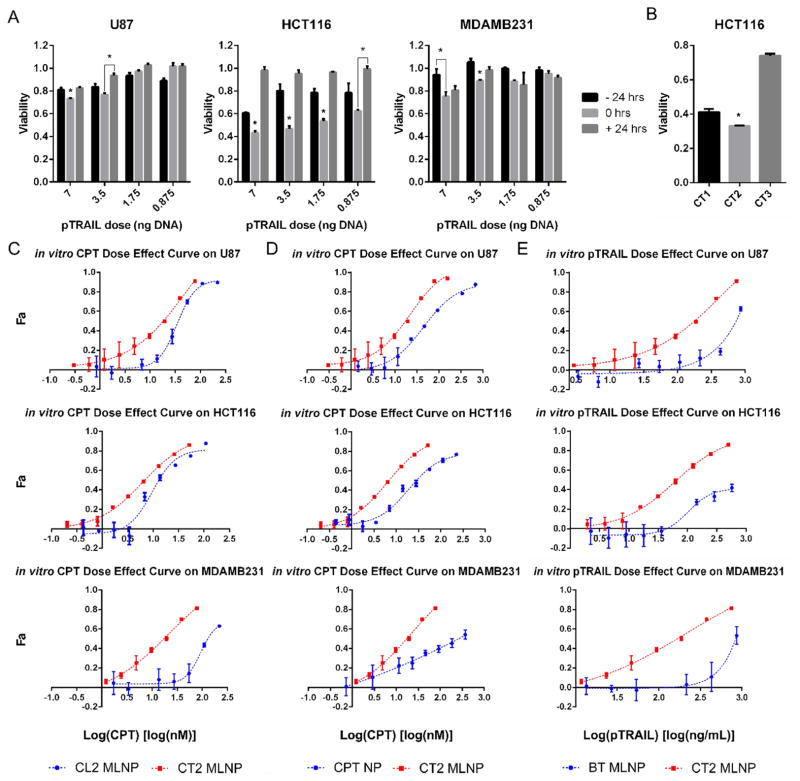
Figure 4. Antitumor effects of MLNPs in vitro.
A. Tumor death kinetics relative to free CPT drug exposure and transfection with pTRAIL at multiple doses. U87, HCT116, and MDAMB231 cells were exposed to CPT 24 h before, during (0 h), or 24 h after transfection. B. HCT116 cell viability 72 h after exposure to MLNPs loaded with CPT to pTRAIL mass ratios of 5, 0.03, and 0.01 (CT1, CT2, and CT3 respectively). Treatment with CT2 MLNPs resulted in significantly lower cell proliferation. C–E. Dose effect curves. C. Tumor cells were exposed to CL2 MLNPs, and CT2 MLNPs. D. Tumor cells were exposed to CT2 MLNPs and CPT NPs. E. Tumor cells were exposed to BT MLNPs or CT2 MLNPs. CT2 and CL2 MLNPs were loaded with a CPT to pDNA mass ratio of 0.03. *P<0.05. BT MLNPs - MLNPs delivering only pTRAIL, CL2 MLNP - MLNPs delivering CPT and pLuc, CPT - camptothecin, CPT NP – PLGA nanoparticles encapsulating CPT, CT1-3 – CPT and TRAIL encoding plasmid MLNPs at different CPT to pTRAIL ratios, CT2 MLNP - MLNPs delivering CPT and pTRAIL, Fa – fraction effected, MLNP – multi-layered nanoparticles, PLGA - poly(lactic-co-glycolic), pLuc – luciferase encoding plasmid, pTRAIL – TRAIL encoding plasmid, TRAIL – TNF related apoptosis inducing ligand.

