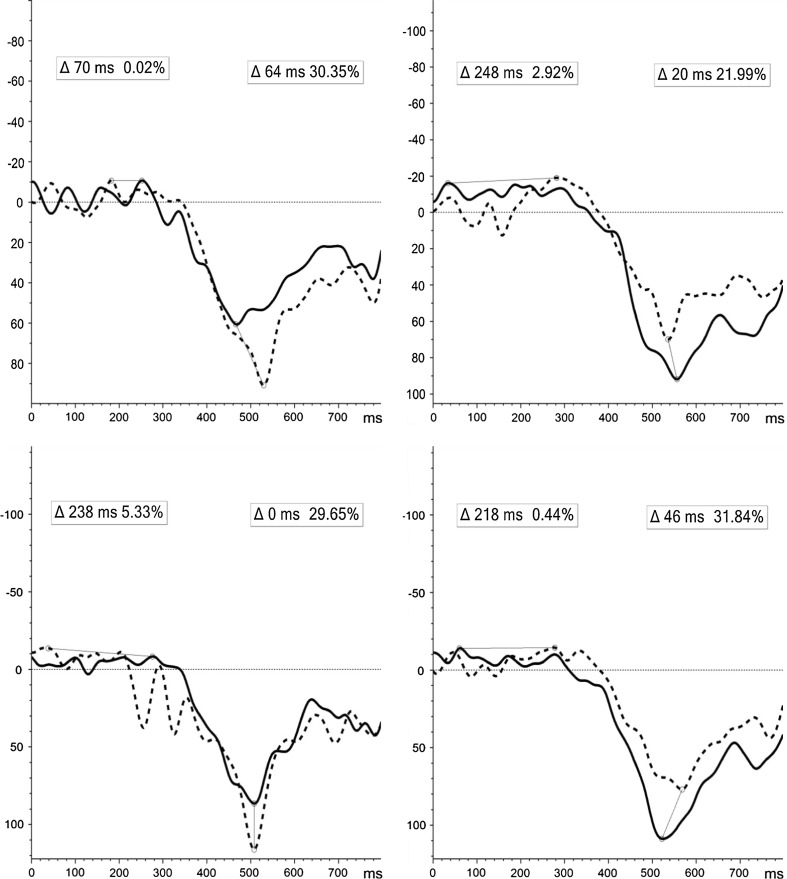
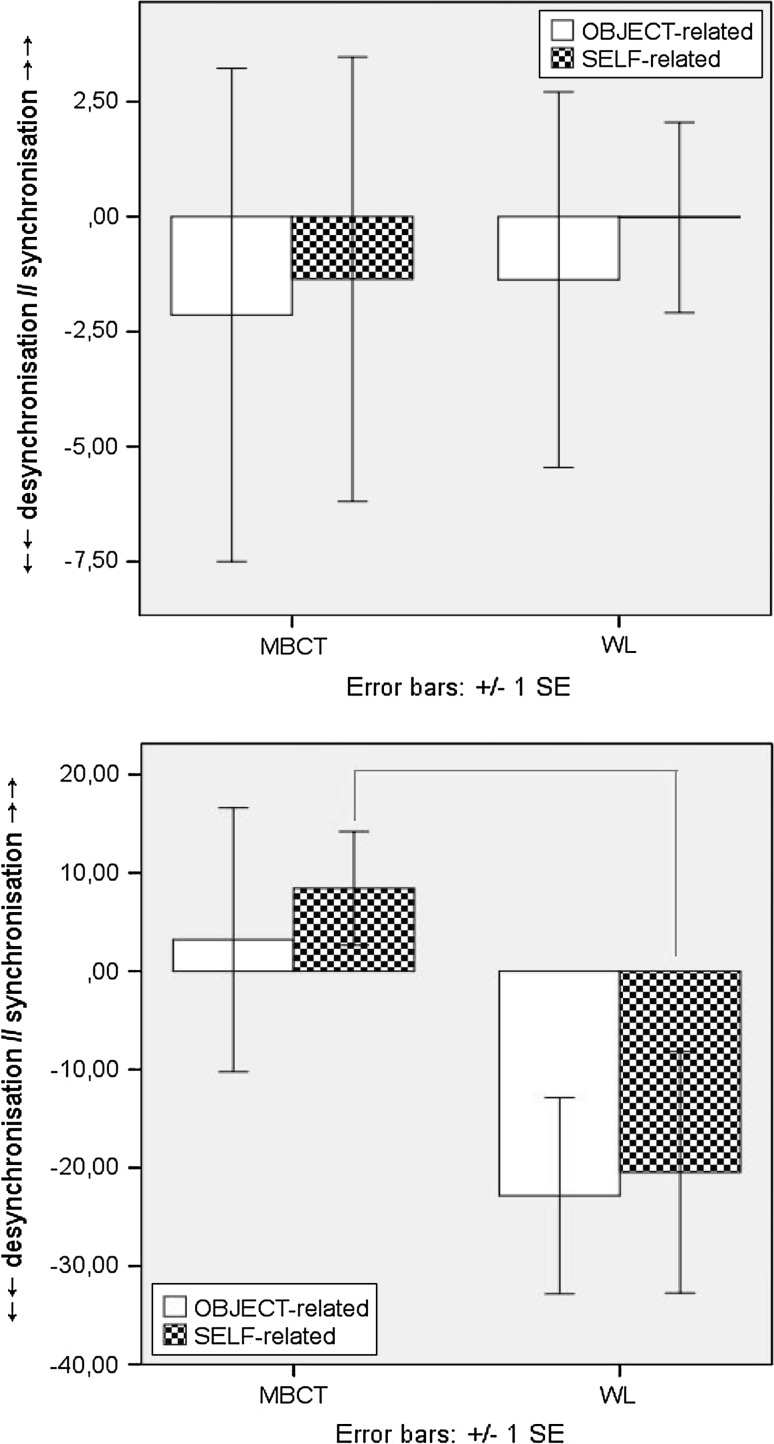
Fig. 5.
a ERD/ERS induced activity for NoGo-T self-related (above), and object-related (below), stimuli at T1 (line) and T2 (dot) for MBCT (left) and WL (right) groups. b Induced fronto-central ERD/ERS incremental change (T2–T1) for NoGo-T during E:0–400 ms (above) and L:400–800 ms (below) epochs [x-axis = full 800 ms TW; y-axis = desynchronisation (−), synchronisation (+)]. Δ = latency (ms) and peak (%) of difference in induced activity from T1 to T2 for E-TW: 0–400 ms (left) and L-TW: 400–800 ms (right)


