Figure 2.

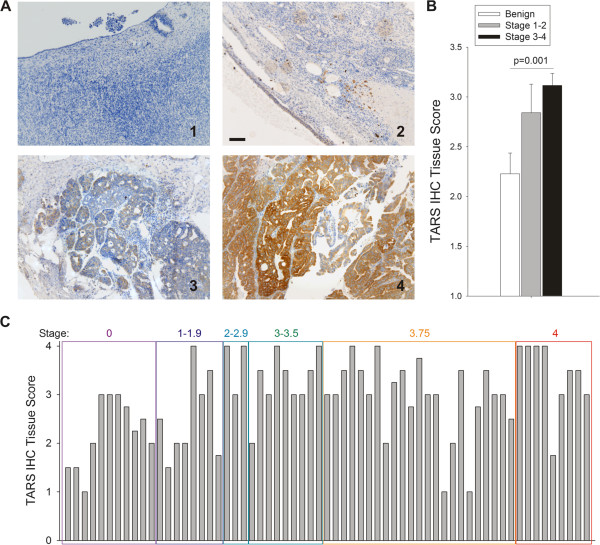
TARS expression increases with stage of ovarian cancer. A. Tissues were stained for TARS by immunohistochemistry and counter-stained with Mayers’ hematoxylin. Images were scored blindly by 2 independent investigators and tumor identification was later confirmed by a pathologist (SLM). Shown are 10x images from (1) normal ovary and examples of TARS score increasing with extent of disease (2–4), Bar = 100 μm. B. Graph representing average scores where high stage is ≥ stage 3; statistical significance determined by one-way ANOVA. For more detailed statistics, see Table 1 for Pearson’s Correlations. C. Shown is a graph of individual patient TARS tumor scores grouped according to FIGO stage of disease (i.e. Stage 3.75 = FIGO 3C).
