Figure 6.

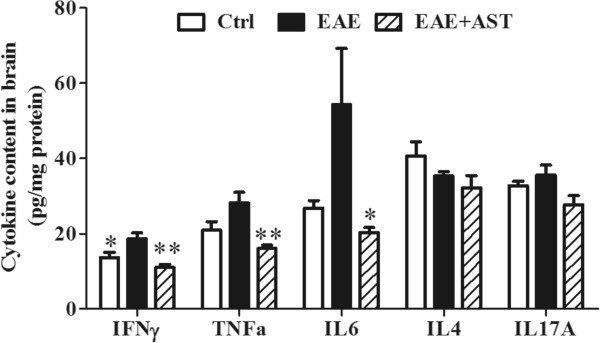
Effect of AST on cytokine profile in cortices of EAE mice. All data are presented as mean±standard error of mean. The dose of AST used was 50 mg/kg/day. n = 5 in each group. *p <0.05; **p < 0.01 vs EAE group.

Effect of AST on cytokine profile in cortices of EAE mice. All data are presented as mean±standard error of mean. The dose of AST used was 50 mg/kg/day. n = 5 in each group. *p <0.05; **p < 0.01 vs EAE group.