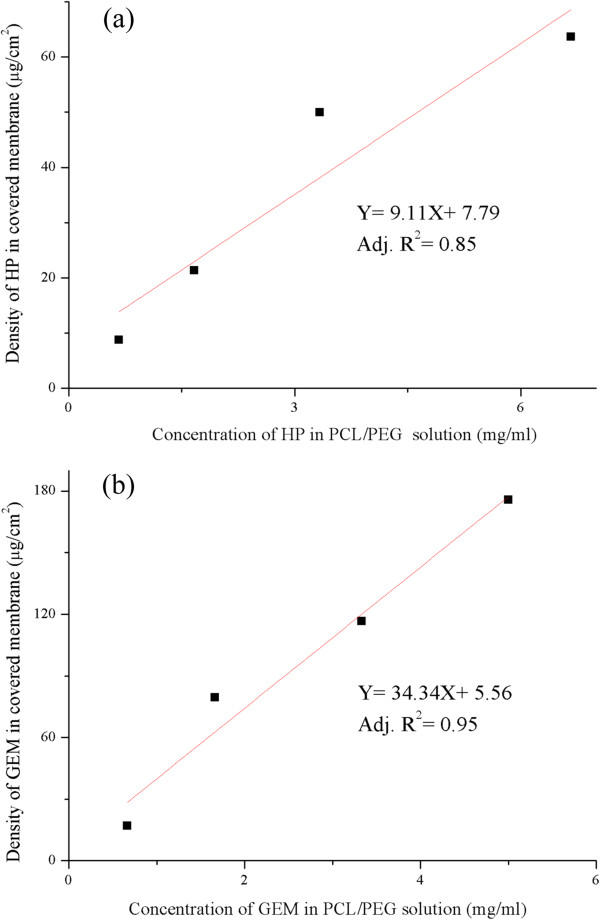
Figure 4.

The electrosprayed amount of the drug on the covered membrane. The density of (a) HP and (b) GEM coated on the covered membrane is illustrated on the vertical axis of this graph, while the drug concentration of HP and GEM in PCL/PEG blends solution respectively is illustrated on the horizontal axis.
