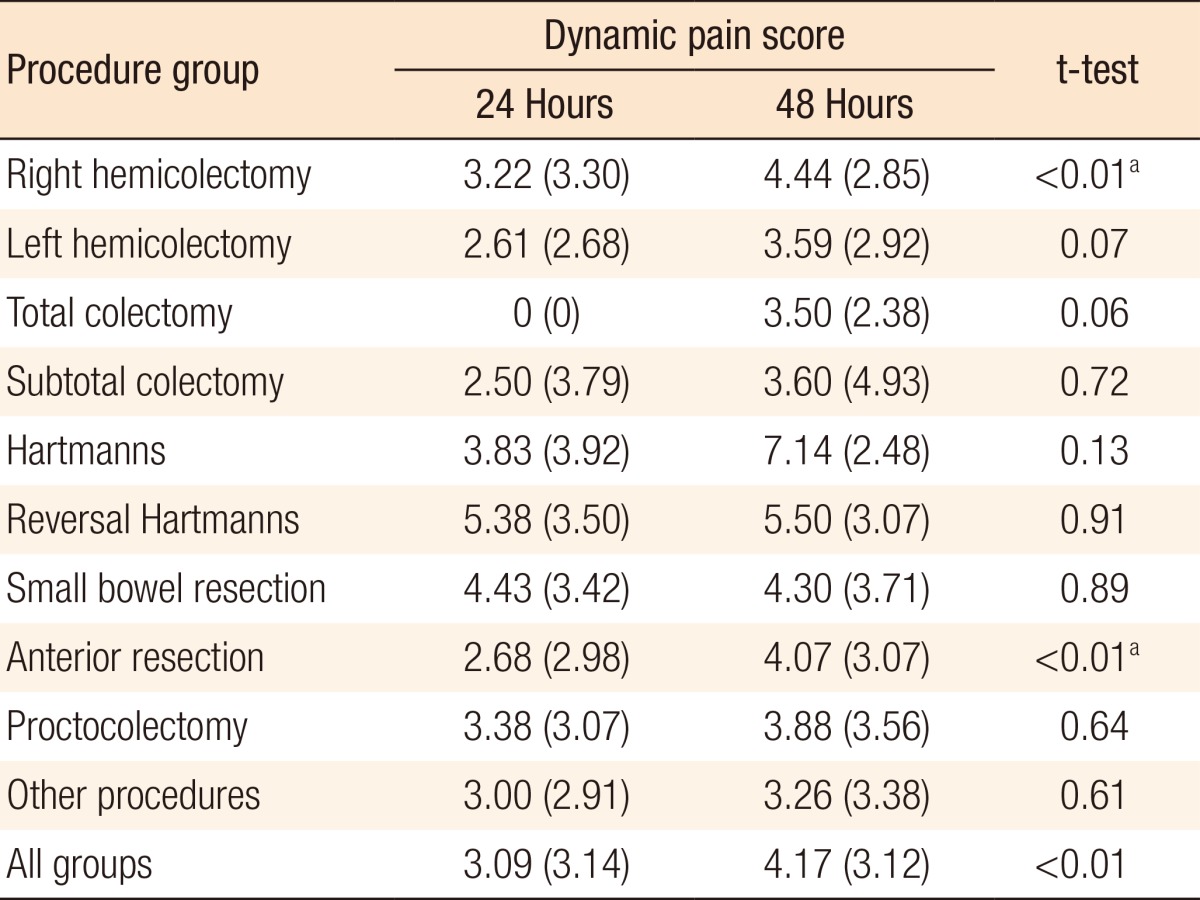
Table 4.
Mean (standard deviation) dynamic pain scores at 24 and 48 hours

Values are presented as mean (standard deviation).
aSignificant at P < 0.05 using the paired two-tailed t-test.
Mean (standard deviation) dynamic pain scores at 24 and 48 hours

Values are presented as mean (standard deviation).
aSignificant at P < 0.05 using the paired two-tailed t-test.