
Table 2.
Comparison of the type and method of feeding, and progress of feeding between the NEC and non-NEC groups
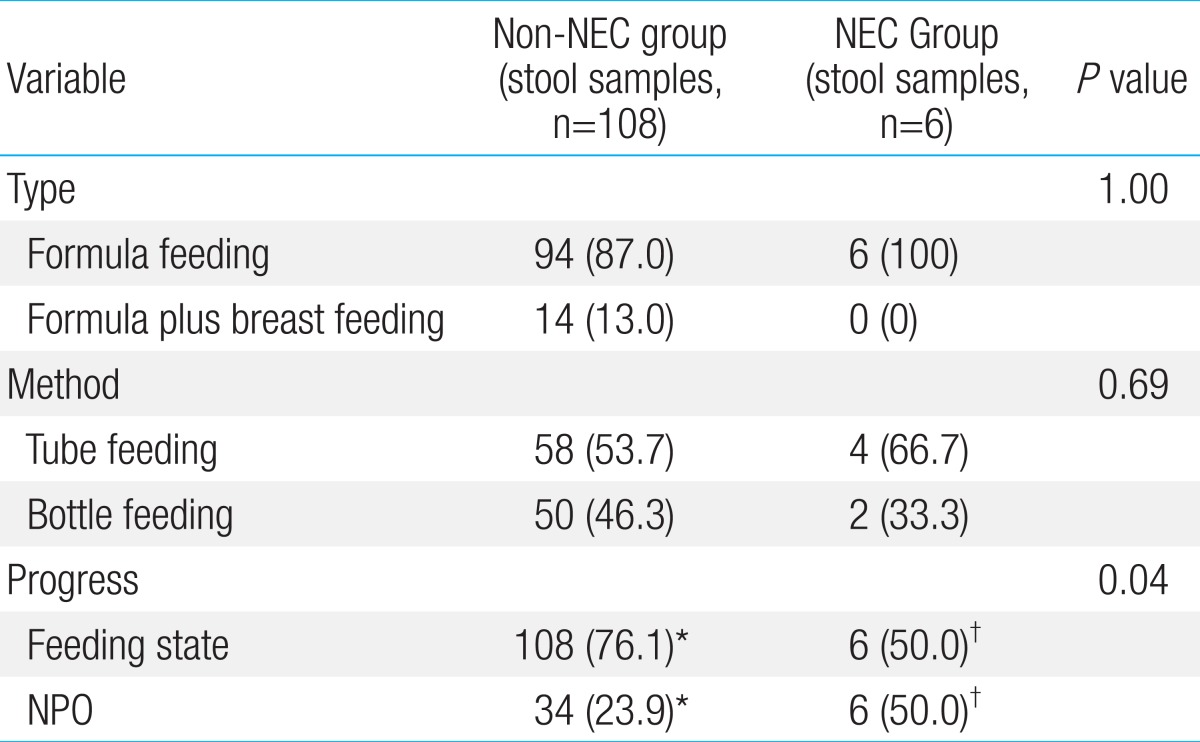
Values are presented as number (%).
NEC, necrotizing enterocolitis; NPO, nulla per os (nothing by mouth).
Stool samples, *n=142. †n=12.
Official websites use .gov
A
.gov website belongs to an official
government organization in the United States.
Secure .gov websites use HTTPS
A lock (
) or https:// means you've safely
connected to the .gov website. Share sensitive
information only on official, secure websites.
Comparison of the type and method of feeding, and progress of feeding between the NEC and non-NEC groups
Values are presented as number (%).
NEC, necrotizing enterocolitis; NPO, nulla per os (nothing by mouth).
Stool samples, *n=142. †n=12.