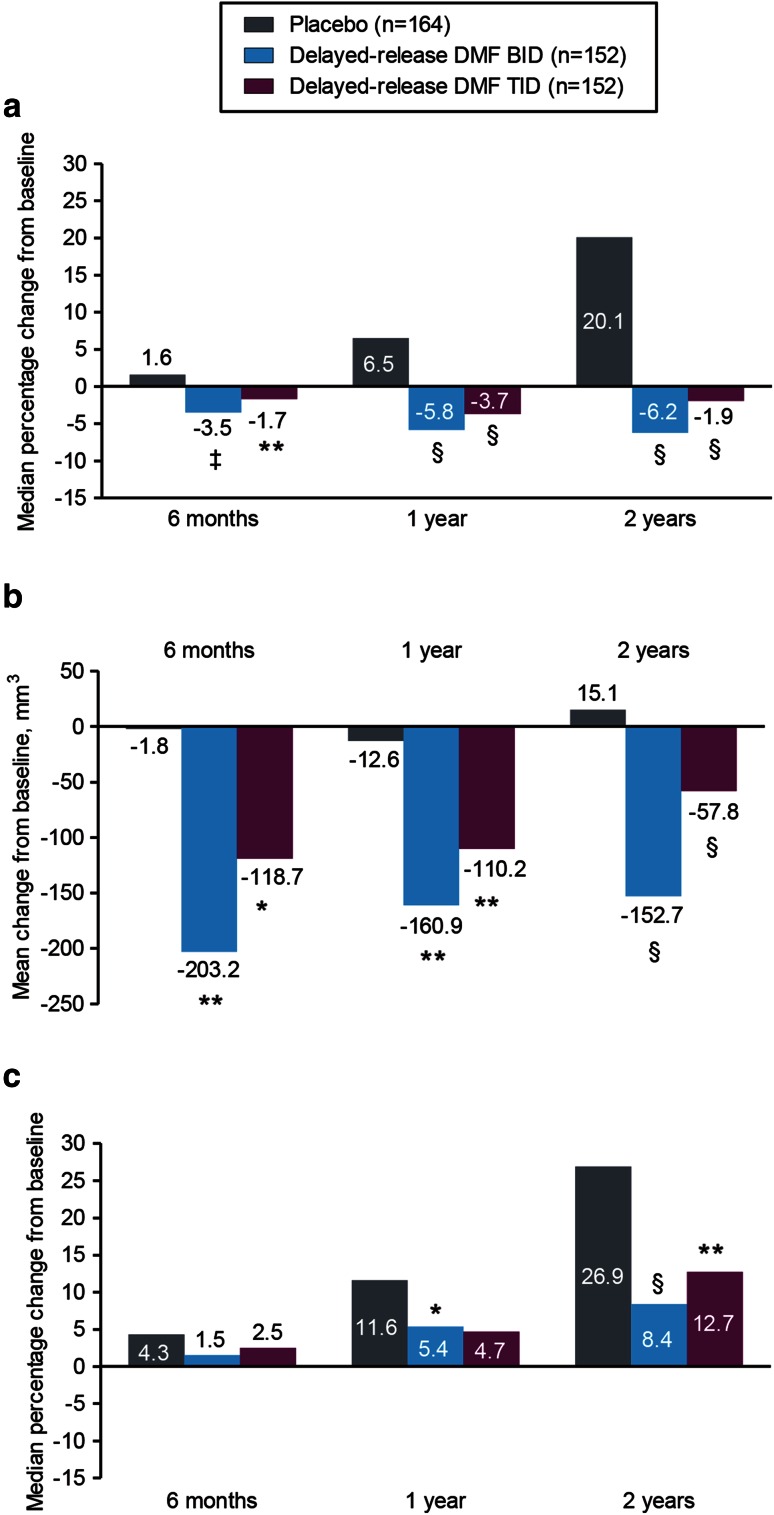
Fig. 3.
Median percentage change in volume of T2-hyperintense lesions (a), mean change from baseline in volume (mm3) of Gd+ lesions (b), and median percentage change in volume of T1-hypointense lesions (c) at 6 months, 1 and 2 years. Patient numbers refer to those who provided data both at baseline and at each scheduled MRI analysis. Comparisons vs. placebo were based on analysis of covariance on ranked data, adjusted for region and baseline lesion volume. *P < 0.05; **P < 0.01; ‡ P < 0.001; § P < 0.0001 vs. placebo. BID twice daily, DMF dimethyl fumarate, Gd+ gadolinium-enhancing, TID three times daily

