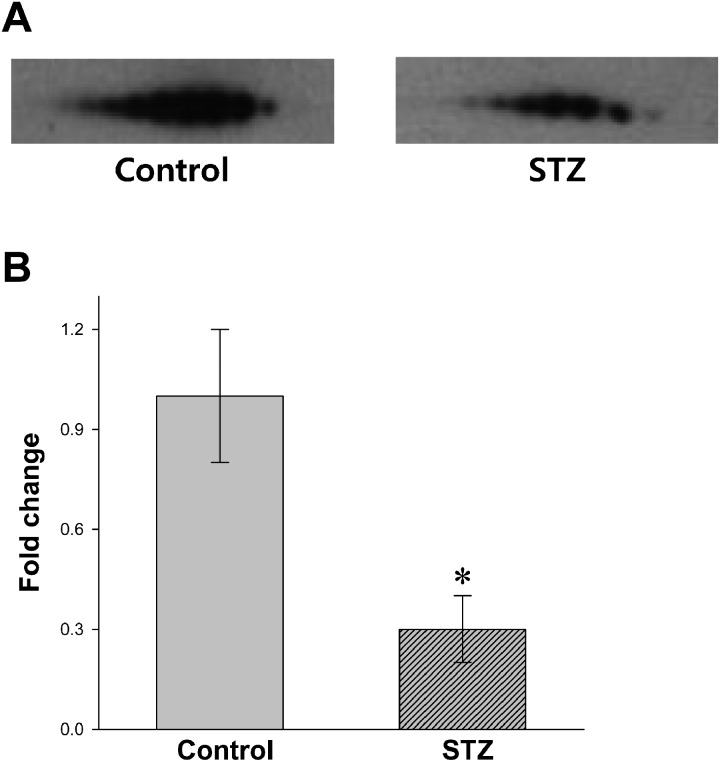
Fig. 3.
Immunoblot (A) and qRT-PCR (B) analyses with PBMC proteins and RNAs, respectively. 2D-PAGE followed by immunoblot was performed with the protein extracts (10 µg) of normal (Control) and STZ-induced diabetic PBMC (STZ). The ECL detection kit was used to visualize the protein spots. The transcriptional level of the albumin gene was expressed by relative fold change after quantitation of cDNA. The transcription level of normal PBMC was normalized to be one (1) in the figure. * P<0.05, n=10 (per each group).

