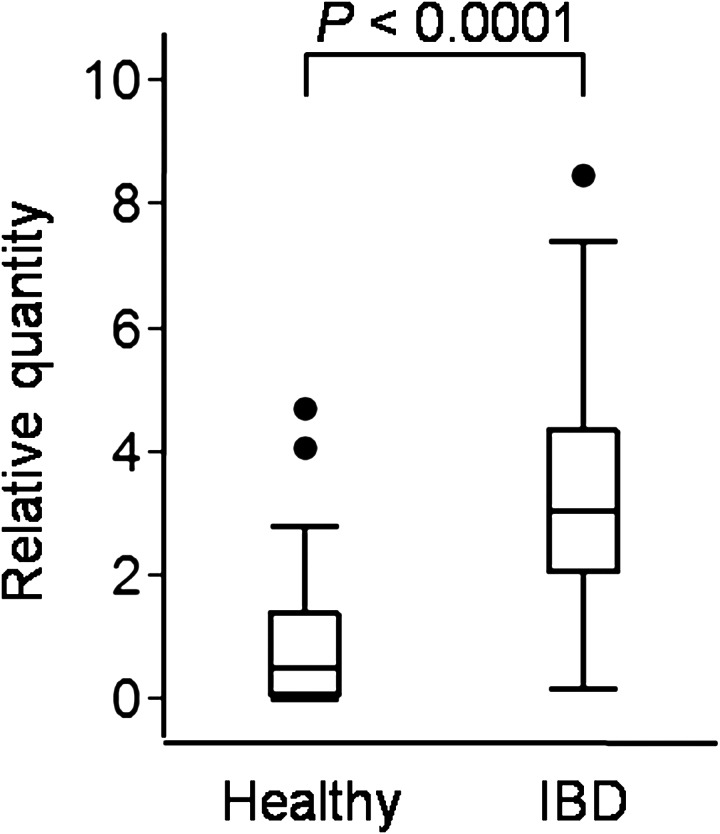
Fig. 2.
The mRNA expression levels of PAR-2 in the duodenal mucosa of healthy dogs (n=25) and dogs with IBD (n=40). TBP, SDHA and GAPDH were used as internal controls. Because the results were similar for the control genes, only the data standardized by TBP are shown. Data are presented as the median with the 25th and 75th quartiles in each box plot. The whiskers indicate the highest and lowest data points within 1.5 times the length of the quartiles. The circles represent outliers.

