
Fig. 4.
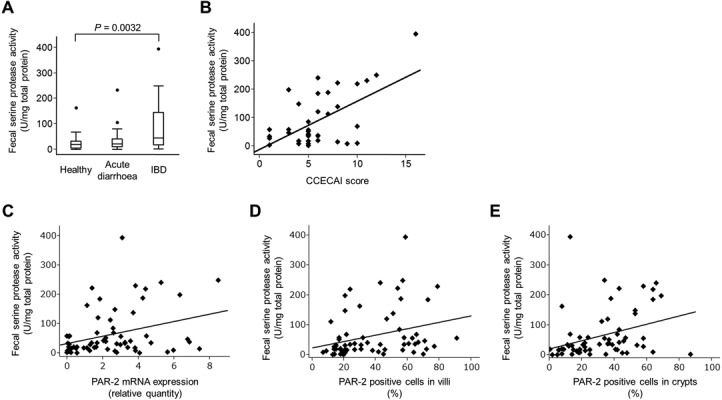
Fecal serine protease activity. (A) Fecal serine protease activity in healthy dogs (n=25), dogs with acute diarrhea (n=22) and dogs with IBD (n=40). The fecal serine protease activity was normalized to the total protein concentration of each sample. Data are presented as the median with the 25th and 75th quartiles in each box plot. The whiskers indicate the highest and lowest data points within 1.5 times the length of the quartiles. The circles represent outliers. (B) Significant correlation between the CCECAI score (x-axis) and the fecal serine protease activity (y-axis) in dogs with IBD (rs=0.3812, P=0.0173). (C) Significant correlation between the duodenal PAR-2 mRNA expression (x-axis) and the fecal serine protease activity (y-axis) in healthy dogs and dogs with IBD (rs=0.2941, P=0.0186). (D) Significant correlation between the proportion of PAR-2+ epithelial cells in the duodenal villi (x-axis) and the fecal serine protease activity (y-axis) in healthy dogs and dogs with IBD (rs=0.3806, P=0.0023). (E) Significant correlation between the proportion of PAR-2+ epithelial cells in the duodenal crypts (x-axis) and the fecal serine protease activity (y-axis) in healthy dogs and dogs with IBD (rs=0.4035, P=0.0012).