
Fig. 1.
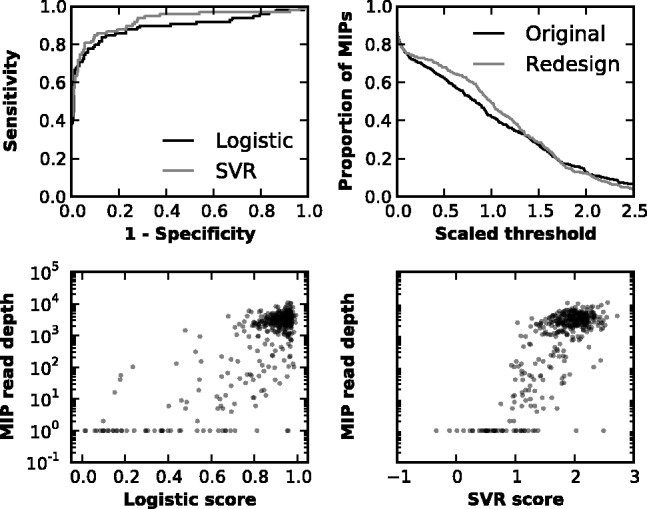
Model scores predict MIP performance. Both logistic and SVR modeling capture most of the variation in MIP performance. SVR scoring displays slightly greater power to discriminate adequately performing MIPs from poorly performing MIPs, as demonstrated by the higher AUC for the ROC curve conditioned on whether an MIP attained at least 10% of the median number of reads per MIP (upper left panel). Additionally, redesigning MIPs to the locus with MIPgen slightly increases the fraction of MIPs attaining levels of coverage at or below the level of average MIP coverage across sets (set to 1.0 in the upper right panel). Also shown are scatterplots of MIP scores versus realized read depth in the redesigned MIP set (lower panels)