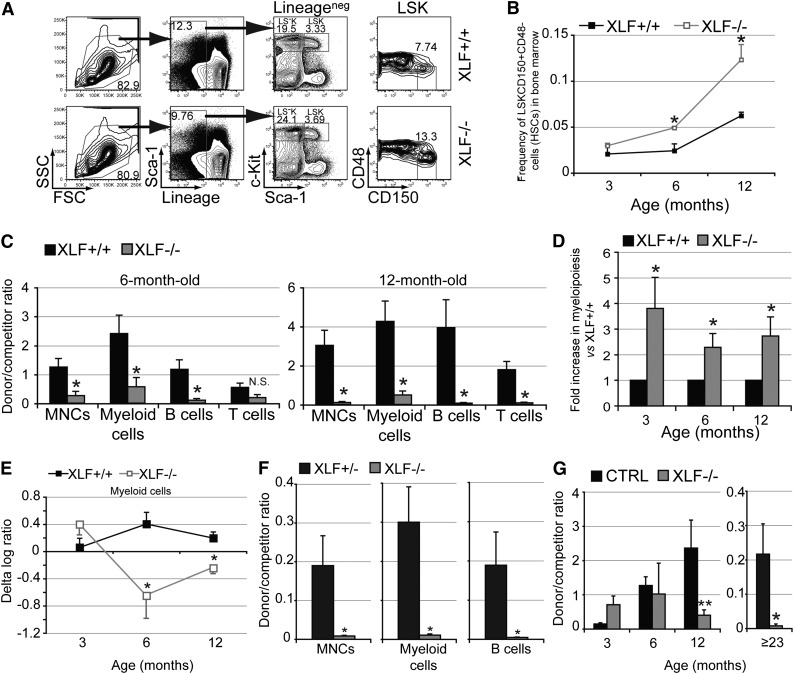
Figure 2.
Functional decline of XLF-deficient HSCs with aging. (A) Representative flow cytometric analysis of lineagenegSca-1+c-Kit+CD150+CD48− HSCs in the BM in XLF−/− and control mice. (B) Frequency of HSCs in the BM at various ages of XLF−/− (n ≥ 3 per age group) and control mice (n ≥ 2 per age group). (C) Ratio of donor to competitor contribution within total MNCs and mature lineages in PB of primary recipients of BM cells from XLF−/− and XLF+/+ mice 10 weeks after transplantation; n ≥ 6 per age group per genotype. XLF−/− and XLF+/+ BM cells within each age group were transplanted with BM cells from a common competitor mouse for easy comparison. Different age groups (3, 6, and 12 months old) were not transplanted at the same time; therefore, absolute chimerism between various age groups of the same genotype cannot be directly compared. (D) Myeloid donor/competitor ratio vs B-cell donor/competitor ratio in primary recipients of XLF−/− BM cells normalized to that of controls; n ≥ 6 per age group per genotype. (E) The δ log ratio within peripheral myeloid cells between secondary and primary transplantations for recipients of XLF+/+ or XLF−/− BM cells; n ≥ 4 per age group per genotype. (F) Ratio of donor to competitor contribution within PB MNCs, myeloid and B cells of primary recipients of purified HSCs from ≥23-month-old XLF+/− or XLF−/− mice with competitor BM cells 10 weeks after transplantation; n ≥ 6 per age group per genotype. (G) Donor-to-competitor ratio within BM lineagenegSca-1+c-Kit+CD150+ HSCs of primary recipients of 3-, 6-, and 12-month-old XLF+/+ (CTRL) and XLF−/− BM cells ≥20 weeks after transplantation, and primary recipients of ≥23-month-old XLF+/− (CTRL) and XLF−/− HSCs ≥17 weeks after transplantation; n ≥ 5 per age group per genotype. Data represent mean ± standard error of the mean. *P < .05, **P < .01. The P values in this figure were calculated using two-tailed Student t test assuming equal variance. FSC, forward scatter; N.S., not significant; SSC, side scatter.

