
Figure 4.
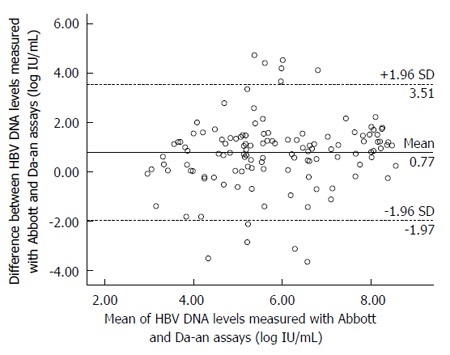
Bland-Altman analysis. Bland-Altman analysis of hepatitis B virus (HBV) DNA level measured with the Abbott and Da-an assays in 126 clinical serum samples from patients with chronic hepatitis B. The difference between the Abbott and Da-an measurements is plotted as a function of the mean of the two values. The area between the dashed lines corresponds to the mean difference ± 1.96 SD.