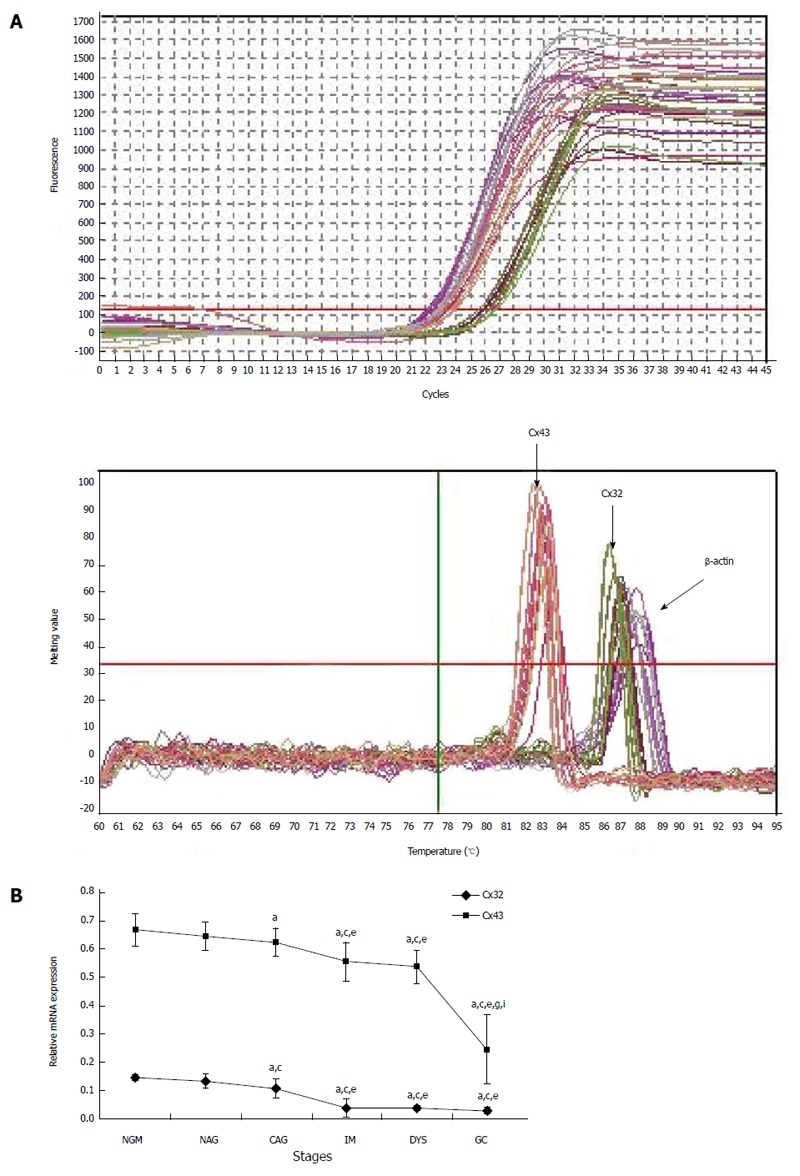
Figure 2.

Real-time polymerase chain reaction results for Cx32 and Cx43 mRNAs. A: The amplification curve and melting curve of the real-time polymerase chain reaction; B: The relative expression of Cx32 and Cx43 mRNAs at different stages. aP < 0.05 vs NGM; cP < 0.05 vs NAG; eP < 0.05 vs CAG; gP < 0.05 vs IM; iP < 0.05 vs DYS. NGM: Normal gastric mucosa; NAG: Non-atrophic gastritis; CAG: Chronic atrophic gastritis; IM: Intestinal metaplasia; DYS: Dysplasia; GC: Gastric cancer.
