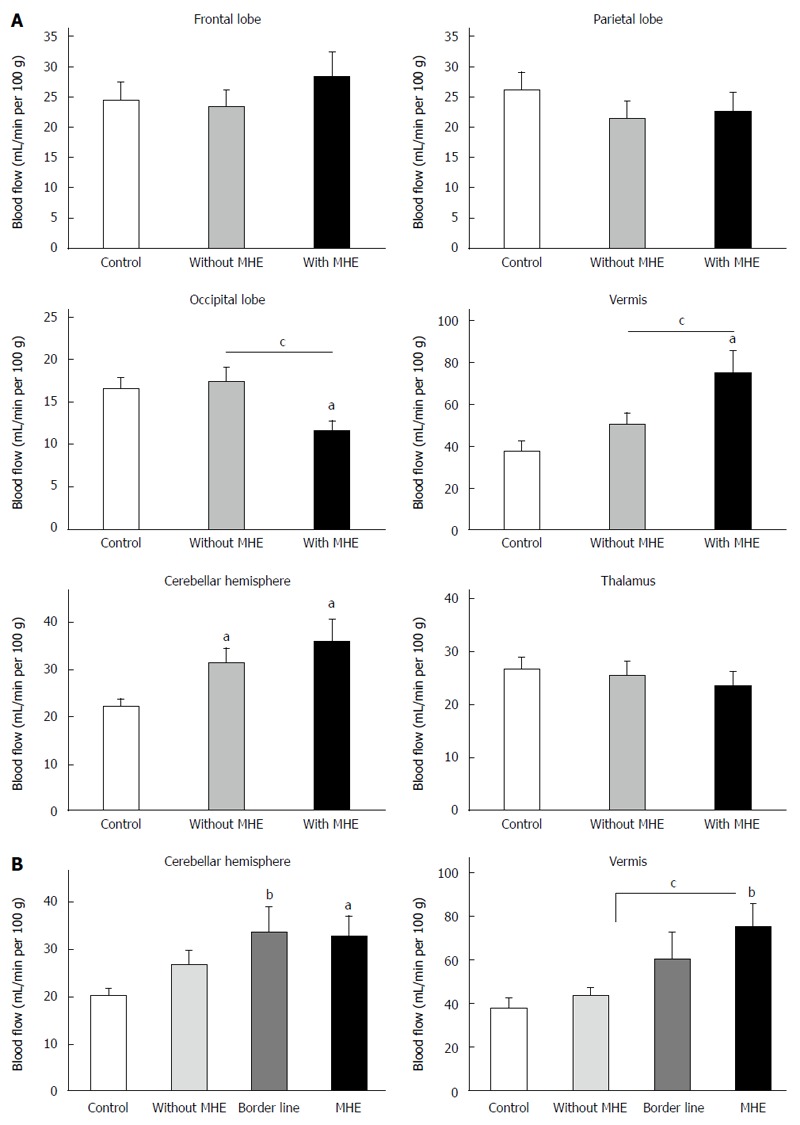
Figure 1.

Blood flow in the different brain regions studied. A: Blood flow in frontal lobe, parietal lobe, occipital lobe, vermis, cerebellar hemisphere and thalamus in controls and cirrhotic patients without and with minimal hepatic encephalopathy (MHE); B: Blood flow in cerebellar hemisphere and vermis including the patients (n = 7) showing Psychometric Hepatic Encephalopathy Score (PHES) = -3, considered as borderline. Data are expressed as mL of blood per minute per 100 g of brain tissue (mean ± SEM) of 14 controls, 24 patients without and 16 with MHE. aP < 0.05; bP < 0.01 vs control, Values significantly different between patients with and without MHE are indicated by cP < 0.05.
