
Figure 2.
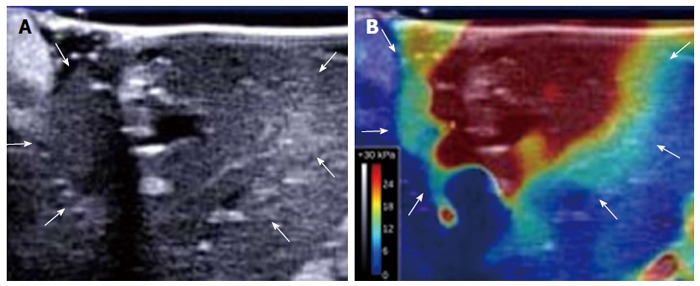
B-mode ultrasound image and shear-wave elastography image of a thermal lesion. A: B-mode ultrasound image of the liver obtained 15 min after ablation shows a poorly defined hypoechoic lesion with a hyperechoic rim (arrows); B: Corresponding shear-wave elastography image of the liver clearly delineates the ablated area (arrows).