
Figure 3.
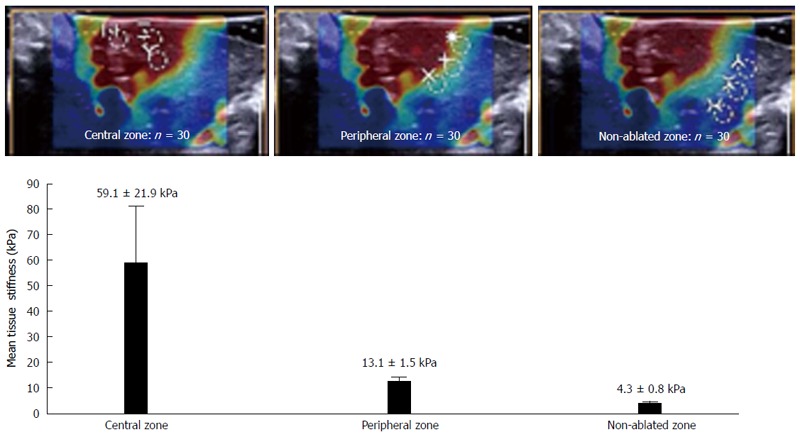
Liver tissue stiffness values of the thermal lesions. Mean tissue stiffness of the central zone, peripheral zone, and non-ablated zone of the livers after radiofrequency ablation. The images at the top show examples of how the regions of interest in each zone were selected.