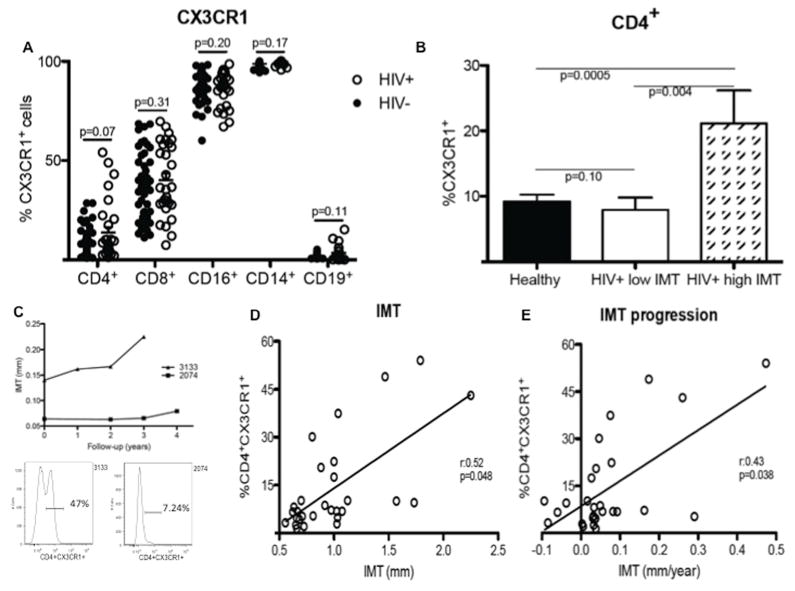
Figure 1. High percentage of CD4+CX3CR1+ T cells in HIV-infected subjects correlates with IMT progression.
(A) Flow cytometric analysis of CX3CR1 expression on CD4+, CD8+, CD16+, CD14+, and CD19+ cells found in PBMCs of HIV-uninfected (HIV−, n=48, blacks circles) and HIV-infected (HIV+, n=29, white circles) subjects. (B) Comparison of the frequency of CX3CR1+CD4+ T cells in HIV− and HIV+ subjects separated into two groups: one with low (<1mm) and another with high (≥1mm) IMT. (C) Carotid artery IMT progression over time in two HIV+ subjects, one (3133) showing a high frequency (47%; see flow cytogram on left) of CX3CR1+CD4+ T cells and the other (2074) showing a low frequency (7.24%; see flow cytogram on right) of CD4+CX3CR1+ T cells. (D) Positive statistical correlation between the frequency of CX3CR1+CD4+ T cells and IMT measurement at baseline. (E) IMT progression over time in HIV+ subjects. Significant correlations were found after adjustment for age.

