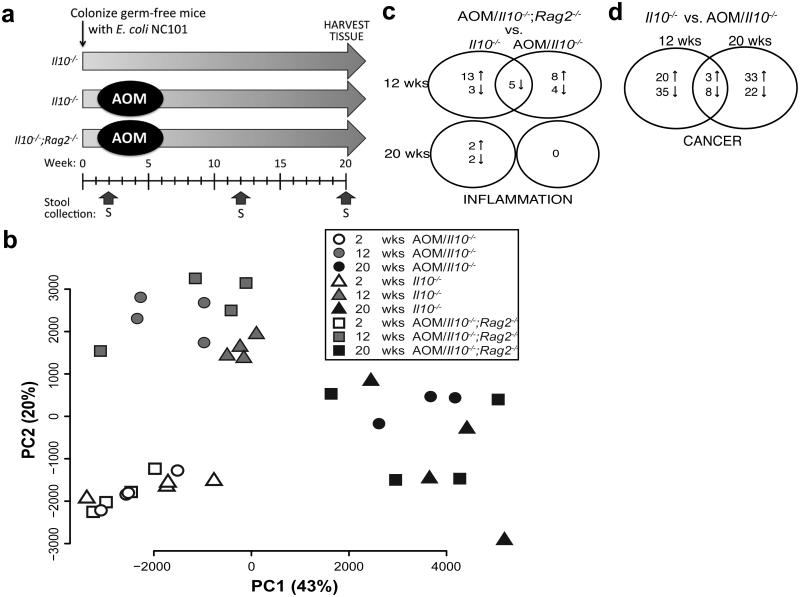
Figure 5. Microbial adaptation to the mammalian intestine drives E. coli transcriptional changes over time.
a) Timeline of sample collection. b) Principal Component Analysis plot constructed from the normalized E. coli gene counts from all samples and time points. Each symbol indicates an individual mouse at each time-point (white=week 2, grey=week12, black=week 20). Shape indicates genotype/disease: circle=AOM/Il10−/− n=4 (20 weeks n=3), triangle=Il10−/− n=4, square=AOM/Il10−/−;Rag2−/− n=4. c-d) Venn diagrams of differential expression (FDR corrected P<0.10) in c) AOM/Il10−/−;Rag2−/− vs. AOM/Il10−/− or Il10−/− (inflammation), d) AOM/Il10−/− vs. Il10−/− (cancer).

