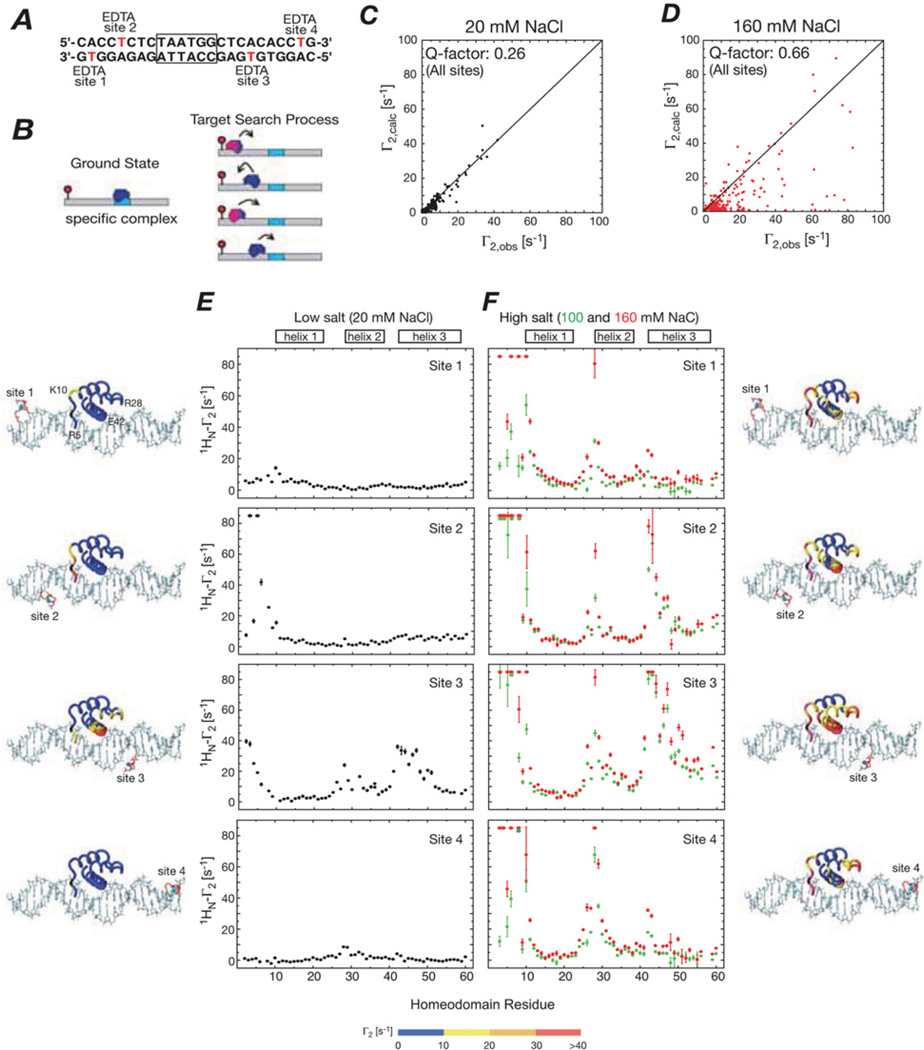
Figure 1. Intermolecular PREs observed for the specific HoxD9-DNA complex in low and high salt corresponding to slow and fast exchange regimes on the PRE relaxation time scale respectively for the interconversion between the specific complex and sparsely populated (<1 %) non-specific complexes.
(A) A 24-bp DNA duplex with the specific site centrally located (boxed) and the location of the four paramagnetic labels (one at a time) indicated. (B) Diagrammatic representation of the specific complex (left) and the target search process whereby the specific complex is located (right). (C and D) Correlation between observed and calculated PREs for all four sites at low (20 mM) and high (160 mM) NaCl concentrations respectively. The calculated Γ2 values are obtained from a model [2] derived from the crystal structure of the Antennapedia homeodomain/DNA complex [40]. (E and F) Intermolecular PRE profiles observed at low (20 mM) and high (100 and 160 mM) NaCl respectively. The PRE data are mapped on the structural model of the specific complex, with the colour-coding depicting the observed PRE values. Adapted from Iwahara, J. and Clore, G.M. (2006) Detecting transient intermediates in macromolecular binding by paramagnetic NMR. Nature 440, 1227–1230 with permission.

