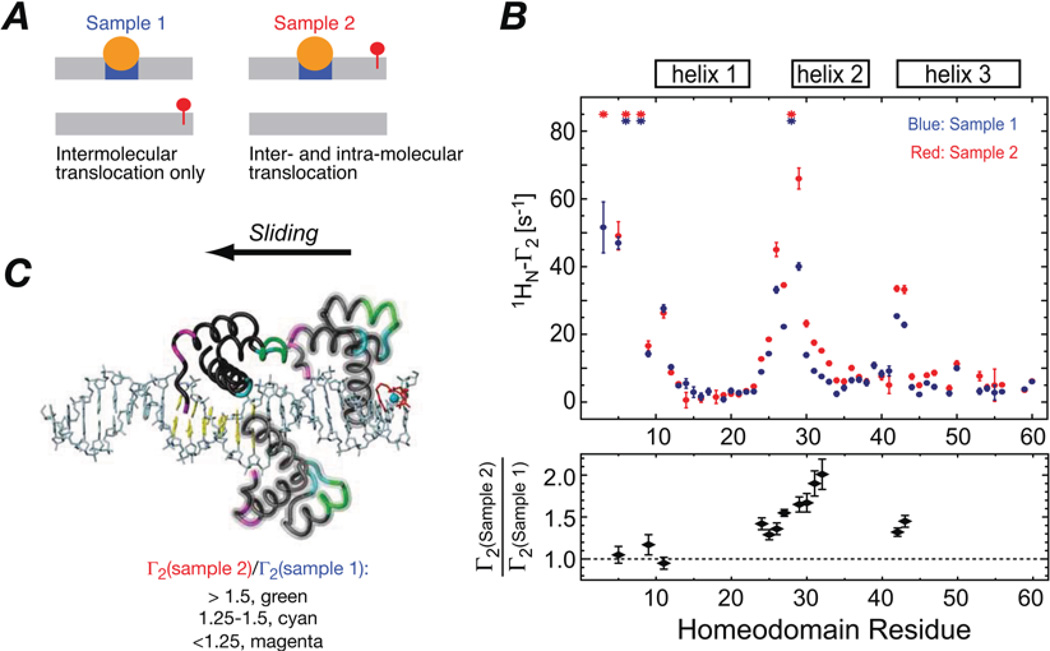
Figure 2. Assessing the contributions of intramolecular sliding and intermolecular translocation for the HoxD9-DNA complex.
(A) PRE data were collected on two samples containing an equimolar concentration of specific and non-specific DNA duplexes with the paramagnetic label attached to the end of the non-specific duplex in sample 1 and to the end of the specific duplex in sample 2. The location of the specific site and the paramagnetic label are indicated in blue and red respectively. (B) PRE profiles observed for samples 1 (blue) and 2 (red) are shown in the upper panel, and the ratio of the observed PRE rates for the two samples is shown in the lower panel. (C) Schematic representation of sliding along the DNA starting from the specific site with HoxD9 coloured according to the Γ2 (sample 2)/Γ2(sample 1) ratio. Adapted from Iwahara, J. and Clore, G.M. (2006) Detecting transient intermediates in macromolecular binding by paramagnetic NMR. Nature 440, 1227–1230 with permission.

