Figure 1.

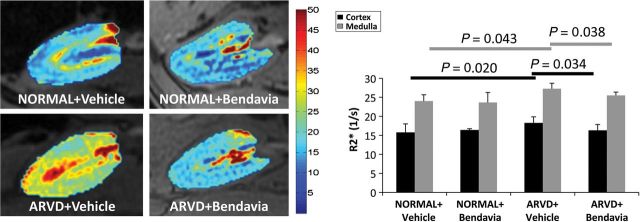
Stenotic-kidney BOLD-MRIs showing hypoxic regions (red), and quantification of R2* in the cortex and medulla (n = 7/group).

Stenotic-kidney BOLD-MRIs showing hypoxic regions (red), and quantification of R2* in the cortex and medulla (n = 7/group).