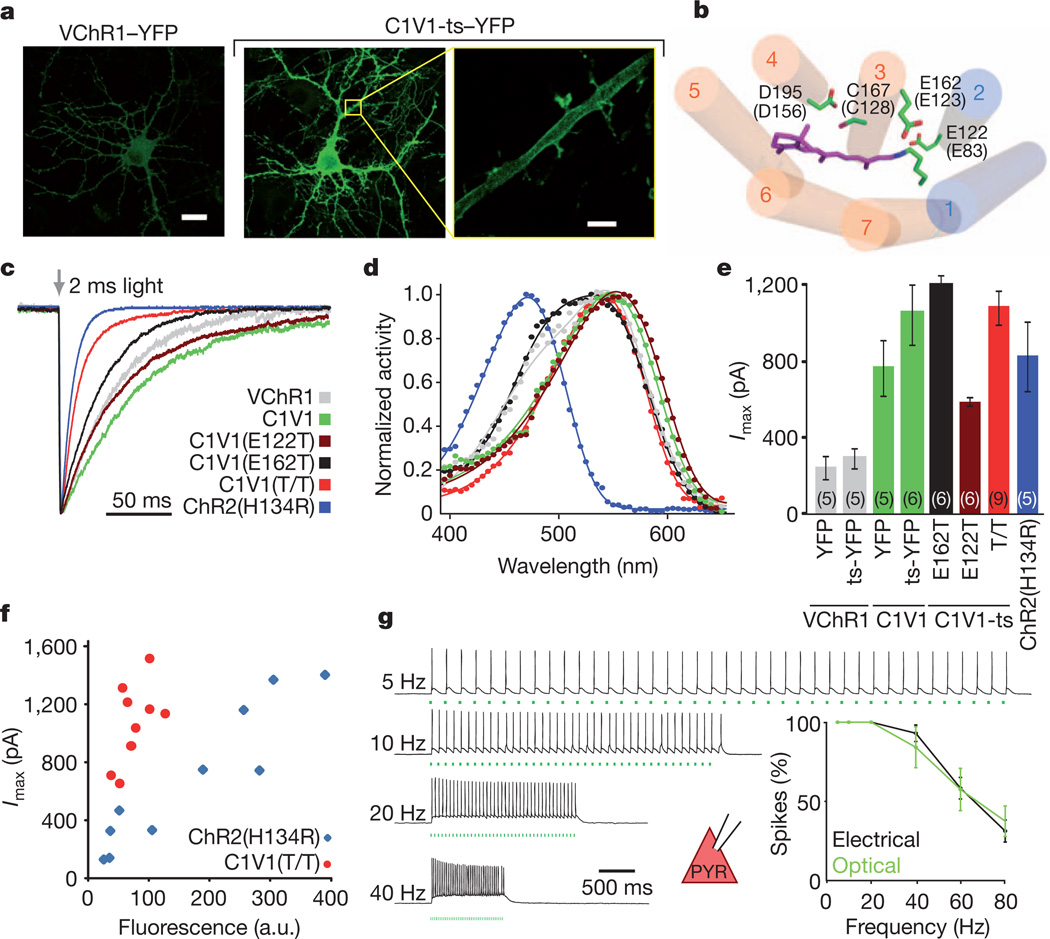
Figure 4. Multistep engineering of a potent redshifted ChR.
a, Confocal images of cultured hippocampal neurons transfected with VChR1–EYFP or C1V1-ts–EYFP under the control of the CaMKIIα promoter. Yellow box denotes region expanded in the last panel, showing dendritic membrane localization of C1V1-ts–EYFP. Scale bars: 20 µm (left, middle), 4 µm (right). b, Model of the C1V1 chromophore binding pocket, showing ChR1 helices in blue, VChR1 helices in orange, the retinal Schiff base (RSB) in purple, and key amino acid residues (with corresponding ChR2 numbering in parentheses and the modelled location of the SSFO mutations C128 and D156 shown for context). c, Representative traces and summary plot of channel closure time constant (τoff) in cultured neurons expressing the indicated channelrhodopsins; traces are normalized to peak current. d, Action spectra collected for the indicated channelrhodopsins (colour code as in c). Photocurrents were collected with 2 ms light pulses in HEK293 cells. e, Mean peak photocurrents recorded in cultured neurons expressing the indicated channelrhodopsins in response to a 2 ms 542 nm light pulse. Colours are as indicated in c; numbers in brackets indicate n. f, Fluorescence–photocurrent relationship in ChR2(H134R) (blue) and C1V1(E122T/E162T) (red). a.u., arbitrary units. g, Acute slice recordings in prefrontal pyramidal neurons (PYR) expressing C1V1(E122T/E162T) and stimulated with 560 nm light pulse trains or current injections at the indicated frequencies. Summary graphs show light and current-evoked spike probability versus stimulation frequency (n = 6; P > 0.4 at all frequencies). All error bars indicate s.e.m.

