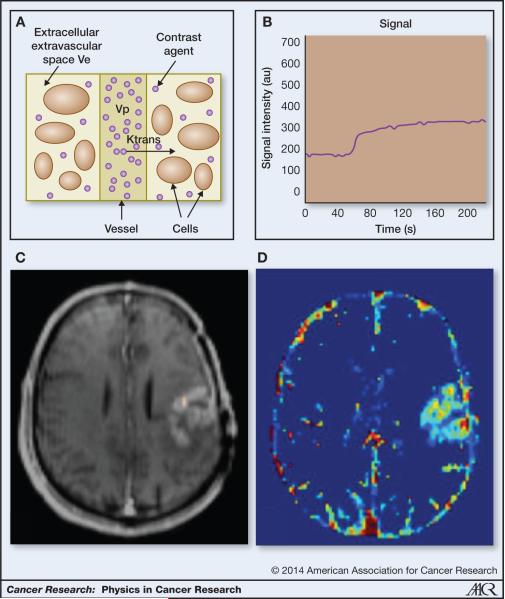
Figure 2.
DCE imaging a. Schematic of DCE compartments including the vascular bed, cells and EES (adapted from Parker et al (37)) b. DCE signal in the contrast-enhancing tumor region of interest c. Example post-contrast T1 image highlights tumor due to contrast agent extravasation d. Ktrans map created by fitting the “Tofts” model to the DCE-MRI signal.

