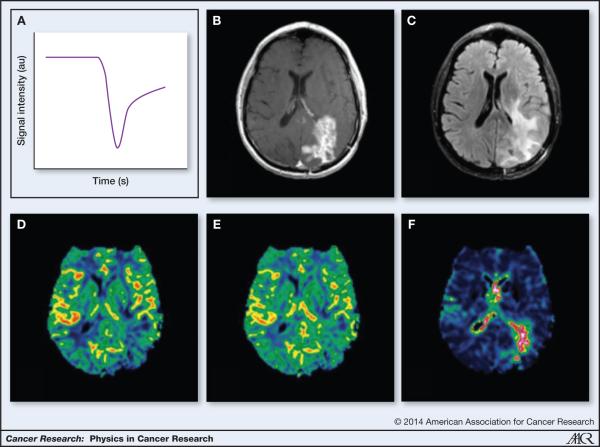
Figure 3.
DSC imaging a. Example DSC signal (T2*) in GBM shows the drop in signal intensity as the bolus of contrast agent passes through b. T1-post contrast image shows areas of contrast enhancing tumor c. FLAIR image shows areas of edema d. Color map of rCBF created using DSC analysis e. Color map of rCBV created using DSC analysis f. Color map of vessel size imaging created using DSC analysis

