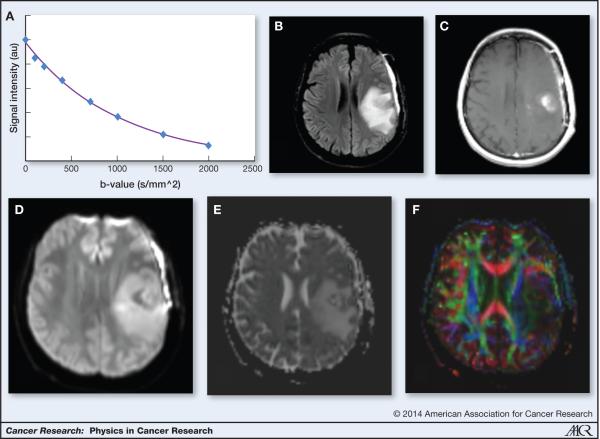
Figure 4.
Diffusion imaging a. Diffusion weighted images acquired at different B-values show an exponential attenuation of the signal. The ADC can be estimated from this curve b. FLAIR image allows the visualization of edema c. Enhancing tumor seen on post-contrast T1-weighted image d. Diffusion weighted image e. ADC map shows increased ADC in areas of edema and areas of low ADC in areas of contrast-enhancing tumor f. Color FA map showing the loss of white matter tracts in areas of peritumoral edema

