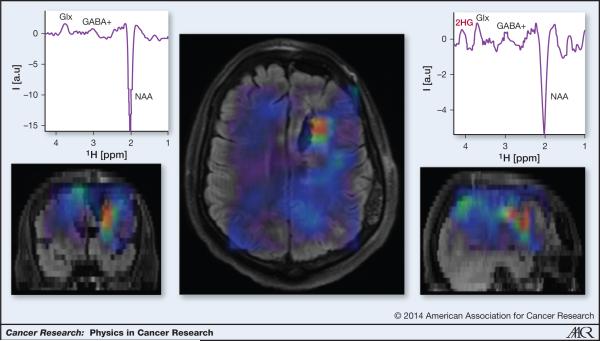
Figure 6.
3D imaging of 2HG in a glioma patient with IDH1 mutation. The 2HG map is overlaid on FLAIR anatomical imaging. High 2HG is found in a limited region around the postsurgical cavity. Note that edema in FLAIR image extend beyond the high 2HG area. Examples of difference MEGA-LASER (121) edited spectra from a voxel in a tumor (right) and a voxel in the contralateral hemisphere are shown.

