
Table 2. Model comparison.
| No | Model description | Mathematical expression | AIC | ΔAIC |
|---|---|---|---|---|
| 1 | The Ratio (R): linear model | 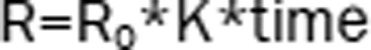 |
1527.26a | – |
| 2 | The Ratio (R): Emax model | 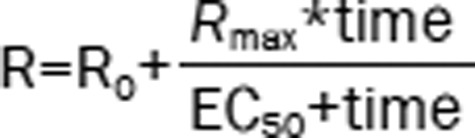 |
1528.69 | 1.43 |
| 3 | The Ratio (R): sigmoid model | 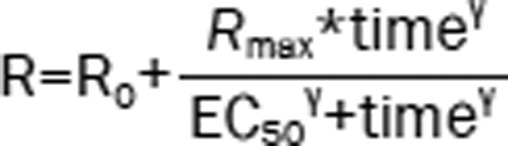 |
1503.43 | −23.83 |
| 4 | The Ratio (R): logistic model | 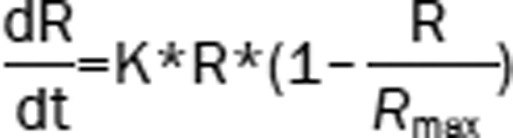 |
1493.96 | −33.3 |
| 5 | The Ratio (R): logistic model Hippocampal volume (V): linear model | 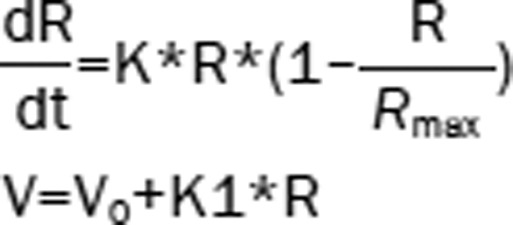 |
1799.68b | – |
| 6 | The Ratio (R): logistic model Hippocampal volume (V): Emax model | 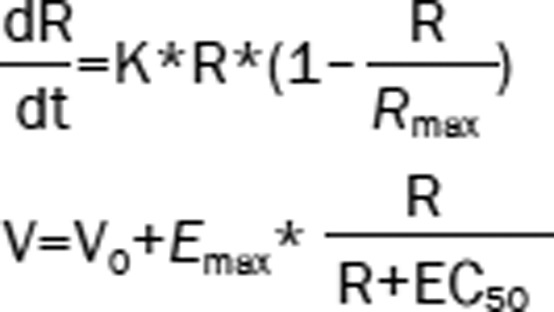 |
1703.77 | −95.91 |
| 7 | The Ratio (R): logistic model Hippocampal volume (V): Sigmoid model | 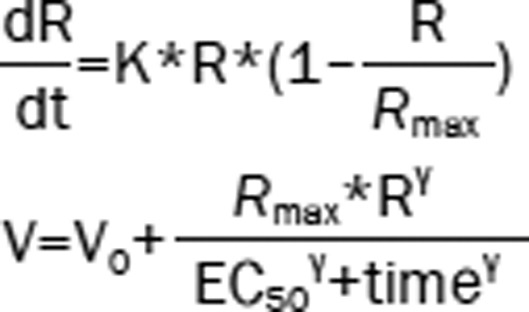 |
1707.04 | −92.64 |
| 8 | The Ratio (R): logistic model Hippocampal volume (V): Emax model ADAS-cog (S): linear model | 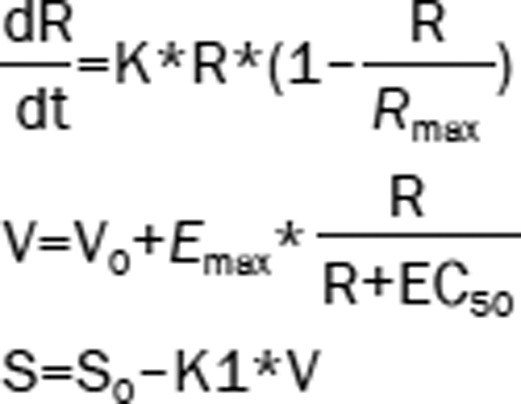 |
3650.75c | – |
| 9 | The Ratio (R): logistic model Hippocampal volume (V): Emax model ADAS-cog (S): Emax model | 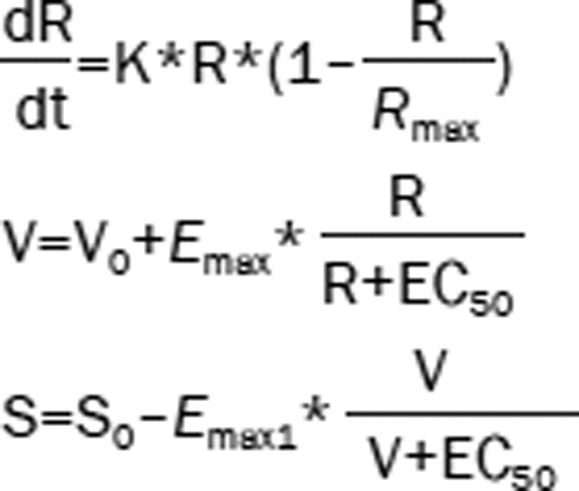 |
3652.75 | 2 |
R0 baseline of the ratio; V0 baseline of hippocampal volume; S0 baseline of ADAS-cog; R0=Aβ0/p-tau0
Rmax was fixed at 30, the largest value observed for the Ratio.
a The AICs of model 2–4 were compared with that of model 1;
b the AICs of model 6–7 were compared with that of model 5;
c the AIC of model 9 was compared with that of model 8; −, not included in the OFV comparison.